Accessibility Menu
Yum! Brands logo

Yum! Brands(NYSE) YUM

Current Price$147.45
Market Cap$40.56BMarket cap calculated using publicly traded shares outstanding only. Does not include unlisted, private, or dual-class non-traded shares. Implied market cap may vary.
Since IPO (1997)+3,983%
5 Year+34%
1 Year+3%
1 Month-3%
Yum! Brands last closing stock price
MetricPriceDate
Last closeUSD 147.172026-07-21
Yum! Brands stock price return by period
PeriodPrice returnPrice at period startPeriod start date
1 week-6.96%USD 158.182026-07-14
1 month-3.17%USD 151.992026-06-18
3 month-7.02%USD 158.292026-04-22
Year to date-1.79%USD 149.852025-12-31
1 year+3.09%USD 142.762025-07-21
3 year+13.36%USD 129.822023-07-21
5 year+34.4%USD 109.502021-07-22
Since inception+3,983.42%USD 3.601997-09-11

Yum! Brands Financials at a Glance

Market Cap

$40.56BMarket cap calculated using publicly traded shares outstanding only. Does not include unlisted, private, or dual-class non-traded shares. Implied market cap may vary.

Revenue (TTM)

$8.49B

Net Income (TTM)

$1.74B

EPS (TTM)

$6.20

P/E Ratio

23.73

Dividend

$2.92

Beta (Volatility)

0.55 (Low)

Price

$147.45

Volume

2,968,156.575

Open

$147.25

Previous Close

$147.57

Daily Range

$145.07 - $150.09

52-Week Range

$137.33 - $170.14

Estimated Earnings Date

Jul 30, 2026

YUM: Motley Fool Moneyball Superscore

70

Our CEO Is Handing Members His Secret Weapon

It's called Motley Fool Moneyball, our new proprietary AI tool

We spent over half a million dollars in R&D to build a tool that makes stock research faster, sharper, and smarter. Our analysts use it every day, and now, you can too.

Get Access Now

About Yum! Brands

Yum Brands helps people find quick and easy meals through its global network of restaurants. The company lets business owners run these shops under famous names like KFC and Taco Bell. These restaurants serve millions of customers chicken, pizza, and burgers across the world.

What Is on the Menu?

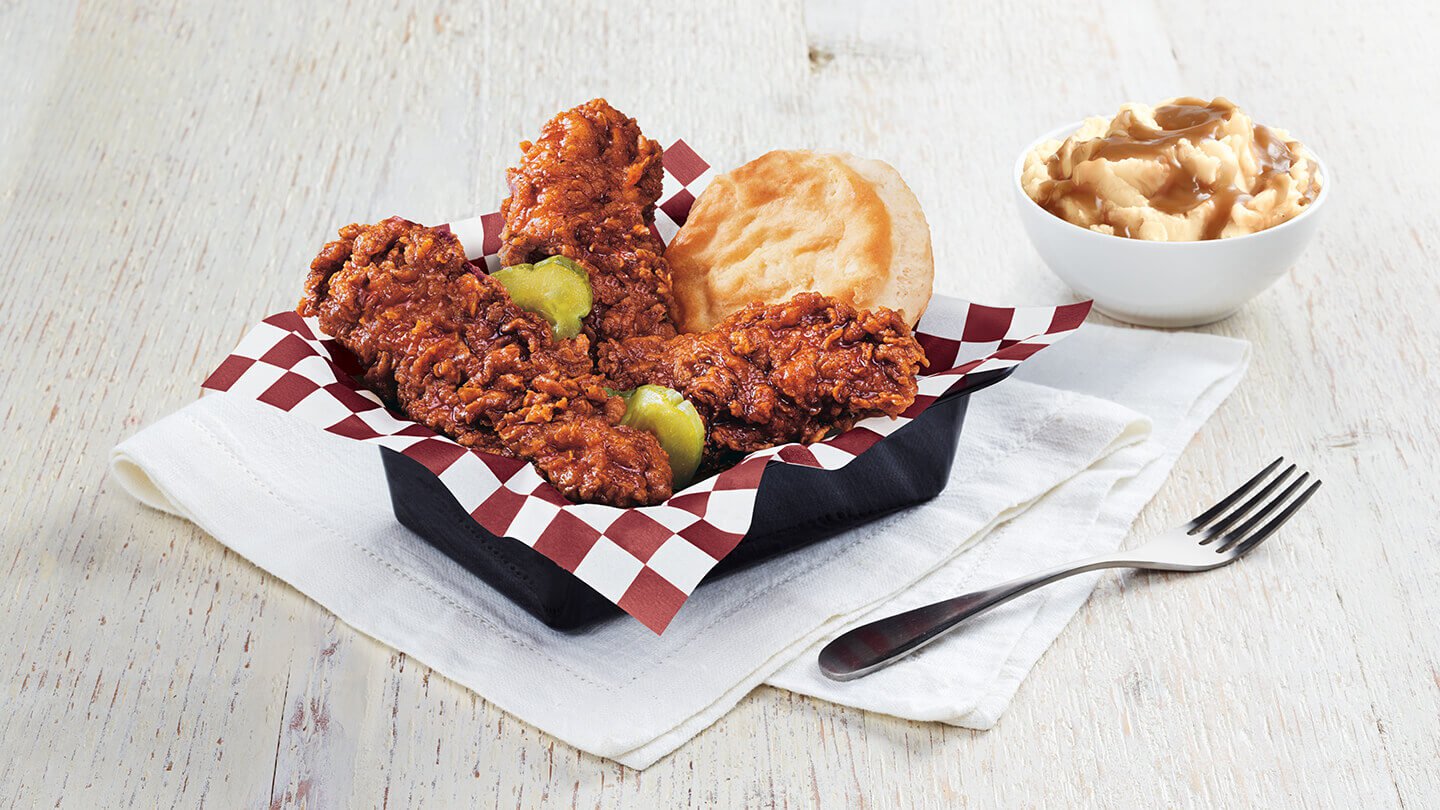
  • KFC Division: Offers fried and non-fried chicken products such as sandwiches and chicken-on-the-bone; represents the largest division with 33,897 units globally.
  • Taco Bell Division: Specializes in Mexican-style food products including tacos, burritos, and quesadillas; consists of 9,030 units primarily in the U.S.
  • Pizza Hut Division: Provides ready-to-eat pizza products through delivery, carryout, and casual dining segments; operates 19,974 units worldwide.
  • Habit Burger & Grill: Focuses on made-to-order chargrilled burgers and sandwiches prepared over an open flame; the smallest division with 384 units.

Growth and Modernization Moves

  • Introduced Byte by Yum! in 2025, a proprietary digital platform using artificial intelligence to manage kitchen and delivery operations.
  • Began a strategic review of the Pizza Hut brand in 2025 to determine the best path for its long-term value.
  • Terminated franchise agreements for KFC and Pizza Hut units in Turkey in early 2025 due to brand standard failures.
  • Partnered with Restaurant Supply Chain Solutions to manage purchasing and lower costs for restaurant supplies and equipment.

What Makes the Company Unique

Yum Brands operates as a nearly 97% franchised business, which allows it to expand rapidly with limited capital investment. The company relies on a massive global scale and shared digital technology to support its independent restaurant owners.

The Recent Financial Performance

  • Revenue reached $2.5 billion in Q4 2025, up 6.4% from the same period in 2024.
  • Net income hit $535 million in Q4 2025, representing a 26.5% increase year-over-year.
  • Free cash flow grew to $482 million in Q4 2025, up 18.4% from $407 million in Q4 2024.
  • Operating income rose to $738 million in Q4 2025, an increase of 12.3% from the previous year.
  • Digital sales approached $40 billion in 2025, accounting for roughly 60% of total system sales.

Bottom Line

Yum Brands has shifted from a traditional restaurant operator to a technology-focused franchisor. Its focus on digital platforms and global franchising supports its position as a leader in the quick-service food industry.

AI Generated • Apr 18, 2026

Industry

Hotels, Restaurants and Leisure

Employees

49,000

CEO

Chris L. Turner, MBA

Headquarters

Louisville, KY 40213, US

YUM Financials

Key Financial Metrics (TTM)

Gross Margin

45.67%

Operating Margin

31.47%

Net Income Margin

20.48%

Return on Equity

-23.33%

Return on Capital

55.18%

Return on Assets

21.17%

Earnings Yield

4.21%

Dividend Yield

1.98%

Payout Ratio

45.91%

Stock Overview

Market Cap

$40.56BMarket cap calculated using publicly traded shares outstanding only. Does not include unlisted, private, or dual-class non-traded shares. Implied market cap may vary.

Shares Outstanding

275.62M

Volume

2.97M

Avg. Volume

2.34M

Financials (TTM)

Gross Profit

$3.88B

Operating Income

$2.67B

EBITDA

$2.91B

Operating Cash Flow

$2.02B

Capital Expenditure

-$375.00M

Free Cash Flow

$1.65B

Cash & ST Invst.

$689.00M

Total Debt

$11.95B

Yum! Brands Performance Analysis

Yum! Brands annual revenue and year-over-year revenue growth by fiscal year
Fiscal yearPeriod endRevenueYoY growth
20222022-12-31USD 6,842,000,0003.9%
20232023-12-31USD 7,076,000,0003.4%
20242024-12-31USD 7,549,000,0006.7%
20252025-12-31USD 8,214,000,0008.8%
Yum! Brands sequential (quarter-over-quarter) revenue growth by fiscal quarter
Fiscal quarterPeriod endQoQ growth
Q22025-06-308.1%
Q32025-09-302.5%
Q42025-12-3127.0%
Q12026-03-31-18.1%
Yum! Brands annual diluted earnings per share and year-over-year EPS growth by fiscal year
Fiscal yearPeriod endDiluted EPSYoY growth
20222022-12-31USD 4.57-12.4%
20232023-12-31USD 5.6022.6%
20242024-12-31USD 5.21-7.0%
20252025-12-31USD 5.556.4%
Yum! Brands sequential (quarter-over-quarter) diluted earnings per share growth by fiscal quarter
Fiscal quarterPeriod endQoQ growth
Q22025-06-3047.8%
Q32025-09-306.0%
Q42025-12-3136.2%
Q12026-03-31-19.3%

Revenue Growth Rate

Annual and quarterly growth comparison

Earnings Per Share Growth Rate

Annual and quarterly EPS growth comparison

Quarterly Performance

Name
Q1 2026YOY CHG

Revenue

$2.06B

+15.2%

Gross Profit

$920.00M

+9.9%

Gross Margin

44.68%

N/A

Market Cap

$40.56BMarket cap calculated using publicly traded shares outstanding only. Does not include unlisted, private, or dual-class non-traded shares. Implied market cap may vary.

N/A

Market Cap/Employee

$827.82K

N/A

Employees

49,000

N/A

Net Income

$432.00M

+70.8%

EBITDA

$700.00M

+17.8%

Quarterly Fundamentals

Name
Q1 2026YOY CHG

Total Cash

$689.00M

+13.5%

Total Debt

$11.95B

+5.3%

Accounts Receivable

$828.00M

+8.8%

Inventory

$0.00

N/A

Long Term Debt

$10.21B

-9.8%

Short Term Debt

$1.74B

+5703.3%

Return on Assets

21.17%

N/A

Return on Invested Capital

52.42%

N/A

Free Cash Flow

$341.00M

+2.4%

Operating Cash Flow

$416.00M

+3.0%

Other Investments to Explore

People Also Watch

Symbol / CompanyPricePrice Chg
DHID.R. Horton, Inc.
$142.52-0.70%
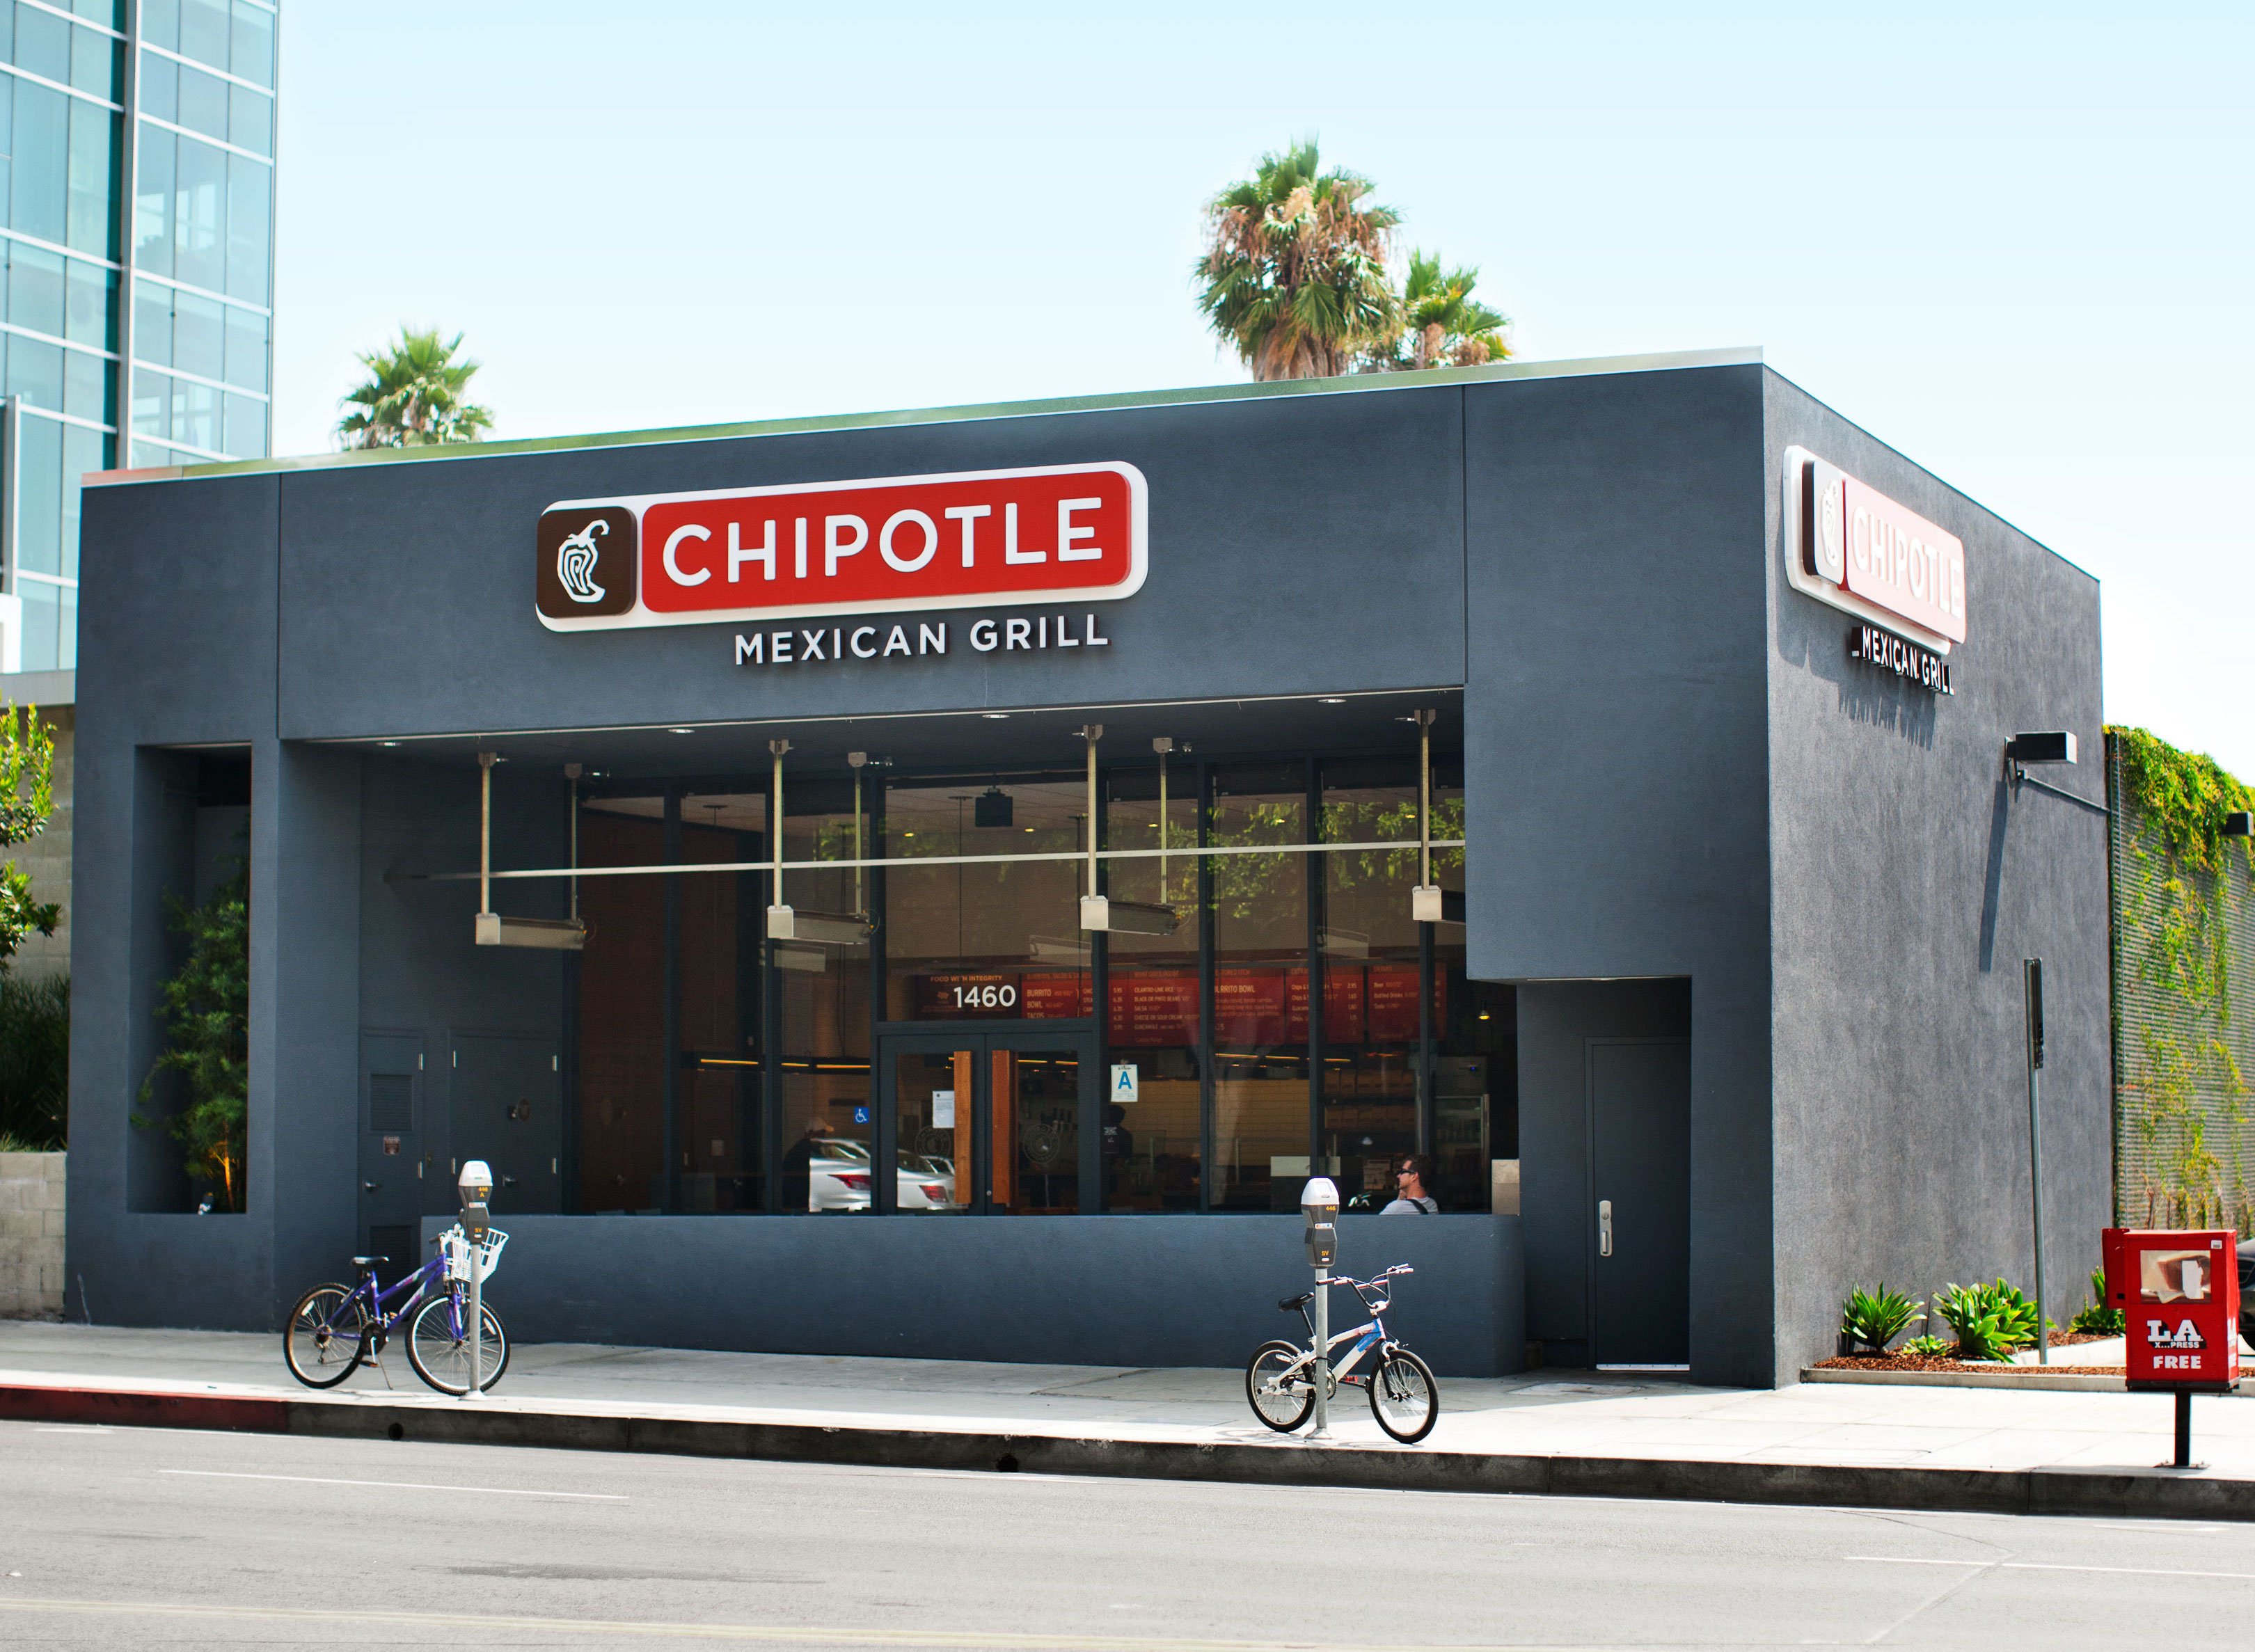
CMGChipotle Mexican Grill, Inc.
$32.20-3.38%
CUKCarnival Corporation & plc
$27.47+0.00%
CCLCarnival Corporation & plc
$26.10-0.23%

Trending Stocks

Symbol / CompanyPricePrice Chg
TAT&T
$23.04+0.04%
SMCISuper Micro Computer
$30.56+0.20%
AALAmerican Airlines Group
$14.79-0.03%
NOKNokia
$10.28-0.03%

Questions About YUM

What is the current price of Yum! Brands?

Yum! Brands is trading at $147.57 per share.

What is the 52-week range for Yum! Brands?

Over the past 52 weeks, Yum! Brands has traded between $137.33 and $170.14.

How much debt does Yum! Brands have?

As of the most recent reporting period, Yum! Brands reported total debt of $13.14B.

How much cash does Yum! Brands have on hand?

Yum! Brands reported $865.00M in cash and cash equivalents in its most recent financial results.

What is Yum! Brands’s dividend yield?

Yum! Brands currently has a dividend yield of 1.98%.

Premium Investing Services

Invest better with The Motley Fool. Get stock recommendations, portfolio guidance, and more from The Motley Fool's premium services.