The lack of affordable housing for low- and extremely low-income households has become a serious problem in the U.S. for several decades. The last two years of historic rental growth and soaring home prices have only made matters worse, causing an even wider gap in available affordable housing.
Here are three charts that show just how serious the problem is.

Image source: Getty Images.
1. There aren't enough affordable homes
The National Low Income Housing Coalition (NLIHC), a not-for-profit organization focused on advocating for affordable housing, found in its 2021 GAP report that for every 100 extremely low-income renter households, which are those who earn 30% or less than the median income for the area, there were only 37 available homes for rent in 2019. Those earning 50% or less of the median income had 60 homes for every 100 households.

Image source: National Low Income Housing Coalition.
Today's affordable housing crisis goes a lot further than housing the nation's poorest families. The number of those who can no longer afford to buy or rent without majorly exceeding the recommended income threshold of 30% is rising due to the movement of the markets over the last two years.
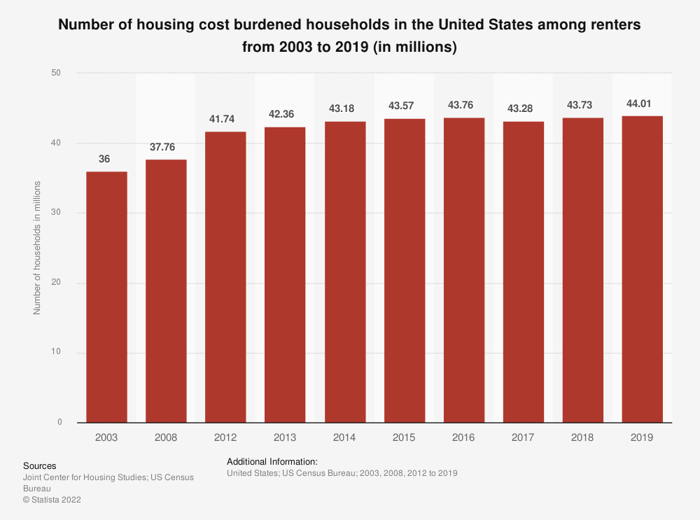
2. The number of burdened households is expanding
Rapid rent growth has been spurred by record demand and a shortage of homes across the board. Homes that were once considered affordable as related to the median income for the area have increased pricing to match market rents, further reducing the supply of affordable homes. The cost of rent jumped 10.1% from 2020 to 2021, with some markets seeing rent prices climb in the 20% to 40% range year over year.
As of January 2022, wages grew at a national average of 4.5% from December 2020, clearly not enough to overcome higher costs for housing. When coupled with inflation, which reached 7% by the end of 2021, it's clear the burden on housing costs is only getting more severe.
A recent report from Vio Smart Security shows that close to half of the country has a rent-to-income ratio of 30% or higher. Florida has the highest percentage of residents paying 30% of their median income on rent, with other expensive states following close behind, like California, Oregon, and New York, to name a few.

Image source: Vio Smart Security.
Cities like Tampa, Florida; Phoenix; Fort Worth, Texas; Charlotte, North Carolina; and Las Vegas, which have seen a huge uptick in inward migration over the past two years, are among the leaders in the greatest change in housing affordability year over year. Notoriously expensive markets on the West Coast like San Francisco, Los Angeles, and Seattle, as well as those on the East Coast, including cities like Boston, Washington D.C., and New York City, continue to be among the worst U.S. cities for affordable housing.
These markets aren't alone. In Q4 2021, 77% of the 575 counties surveyed are less affordable than their historical average, and one in five counties require an income of $75,000 or more to afford the median-priced home.
3. The golden rule is no longer a rule -- more like a pipe dream
No state has an adequate supply of affordable housing for its lowest-income earners, but it's no longer just the lowest-income earners who can't afford to rent or buy. The nation is getting alarmingly close to needing half of all residents to pay 30% or more of their income to rent. Spending 30% or less of income, which is considered the target range for the cost of housing, is no longer the gold standard but an idyllic goal that is unattainable for the average American.
When consumers are forced to spend 30% or more on housing costs, they are considered "house burdened," which means they have less money to spend on items like child care, healthcare, food, gas, and other necessities for living. A recent Statista report shows the number of households that are cost burdened due to housing has increased steadily since 2013, except for 2017. Today, there are an estimated 44.01 million rental households considered cost burdened.
The faces of those who are most impacted are diverse, with a mix of reasons for the financial hardships. This issue disproportionately affects people of color, but seniors and people with disabilities make up around 48% of low-income households impacted by the lack of affordable housing. The issue is widespread, and it impacts all of us. When there is a lack of affordable housing, people can be forced into unsafe living conditions or experience homelessness. This situation can also negatively impact quality of life.
Federal policies and local public housing initiatives are one way to combat the issue, but it won't be enough to fill the growing gap. Those in the private real estate investing market will need to take part in creating and preserving affordable housing units to ensure everyone has a home. Using creative structures to help tenants become homeowners for the long term could be a beneficial play for all involved. And exploring alternative housing constructs, including 3D printed houses, prefab homes, and mobile home communities, could help alleviate construction costs and make housing more affordable for investors, developers, and ultimately tenants.


