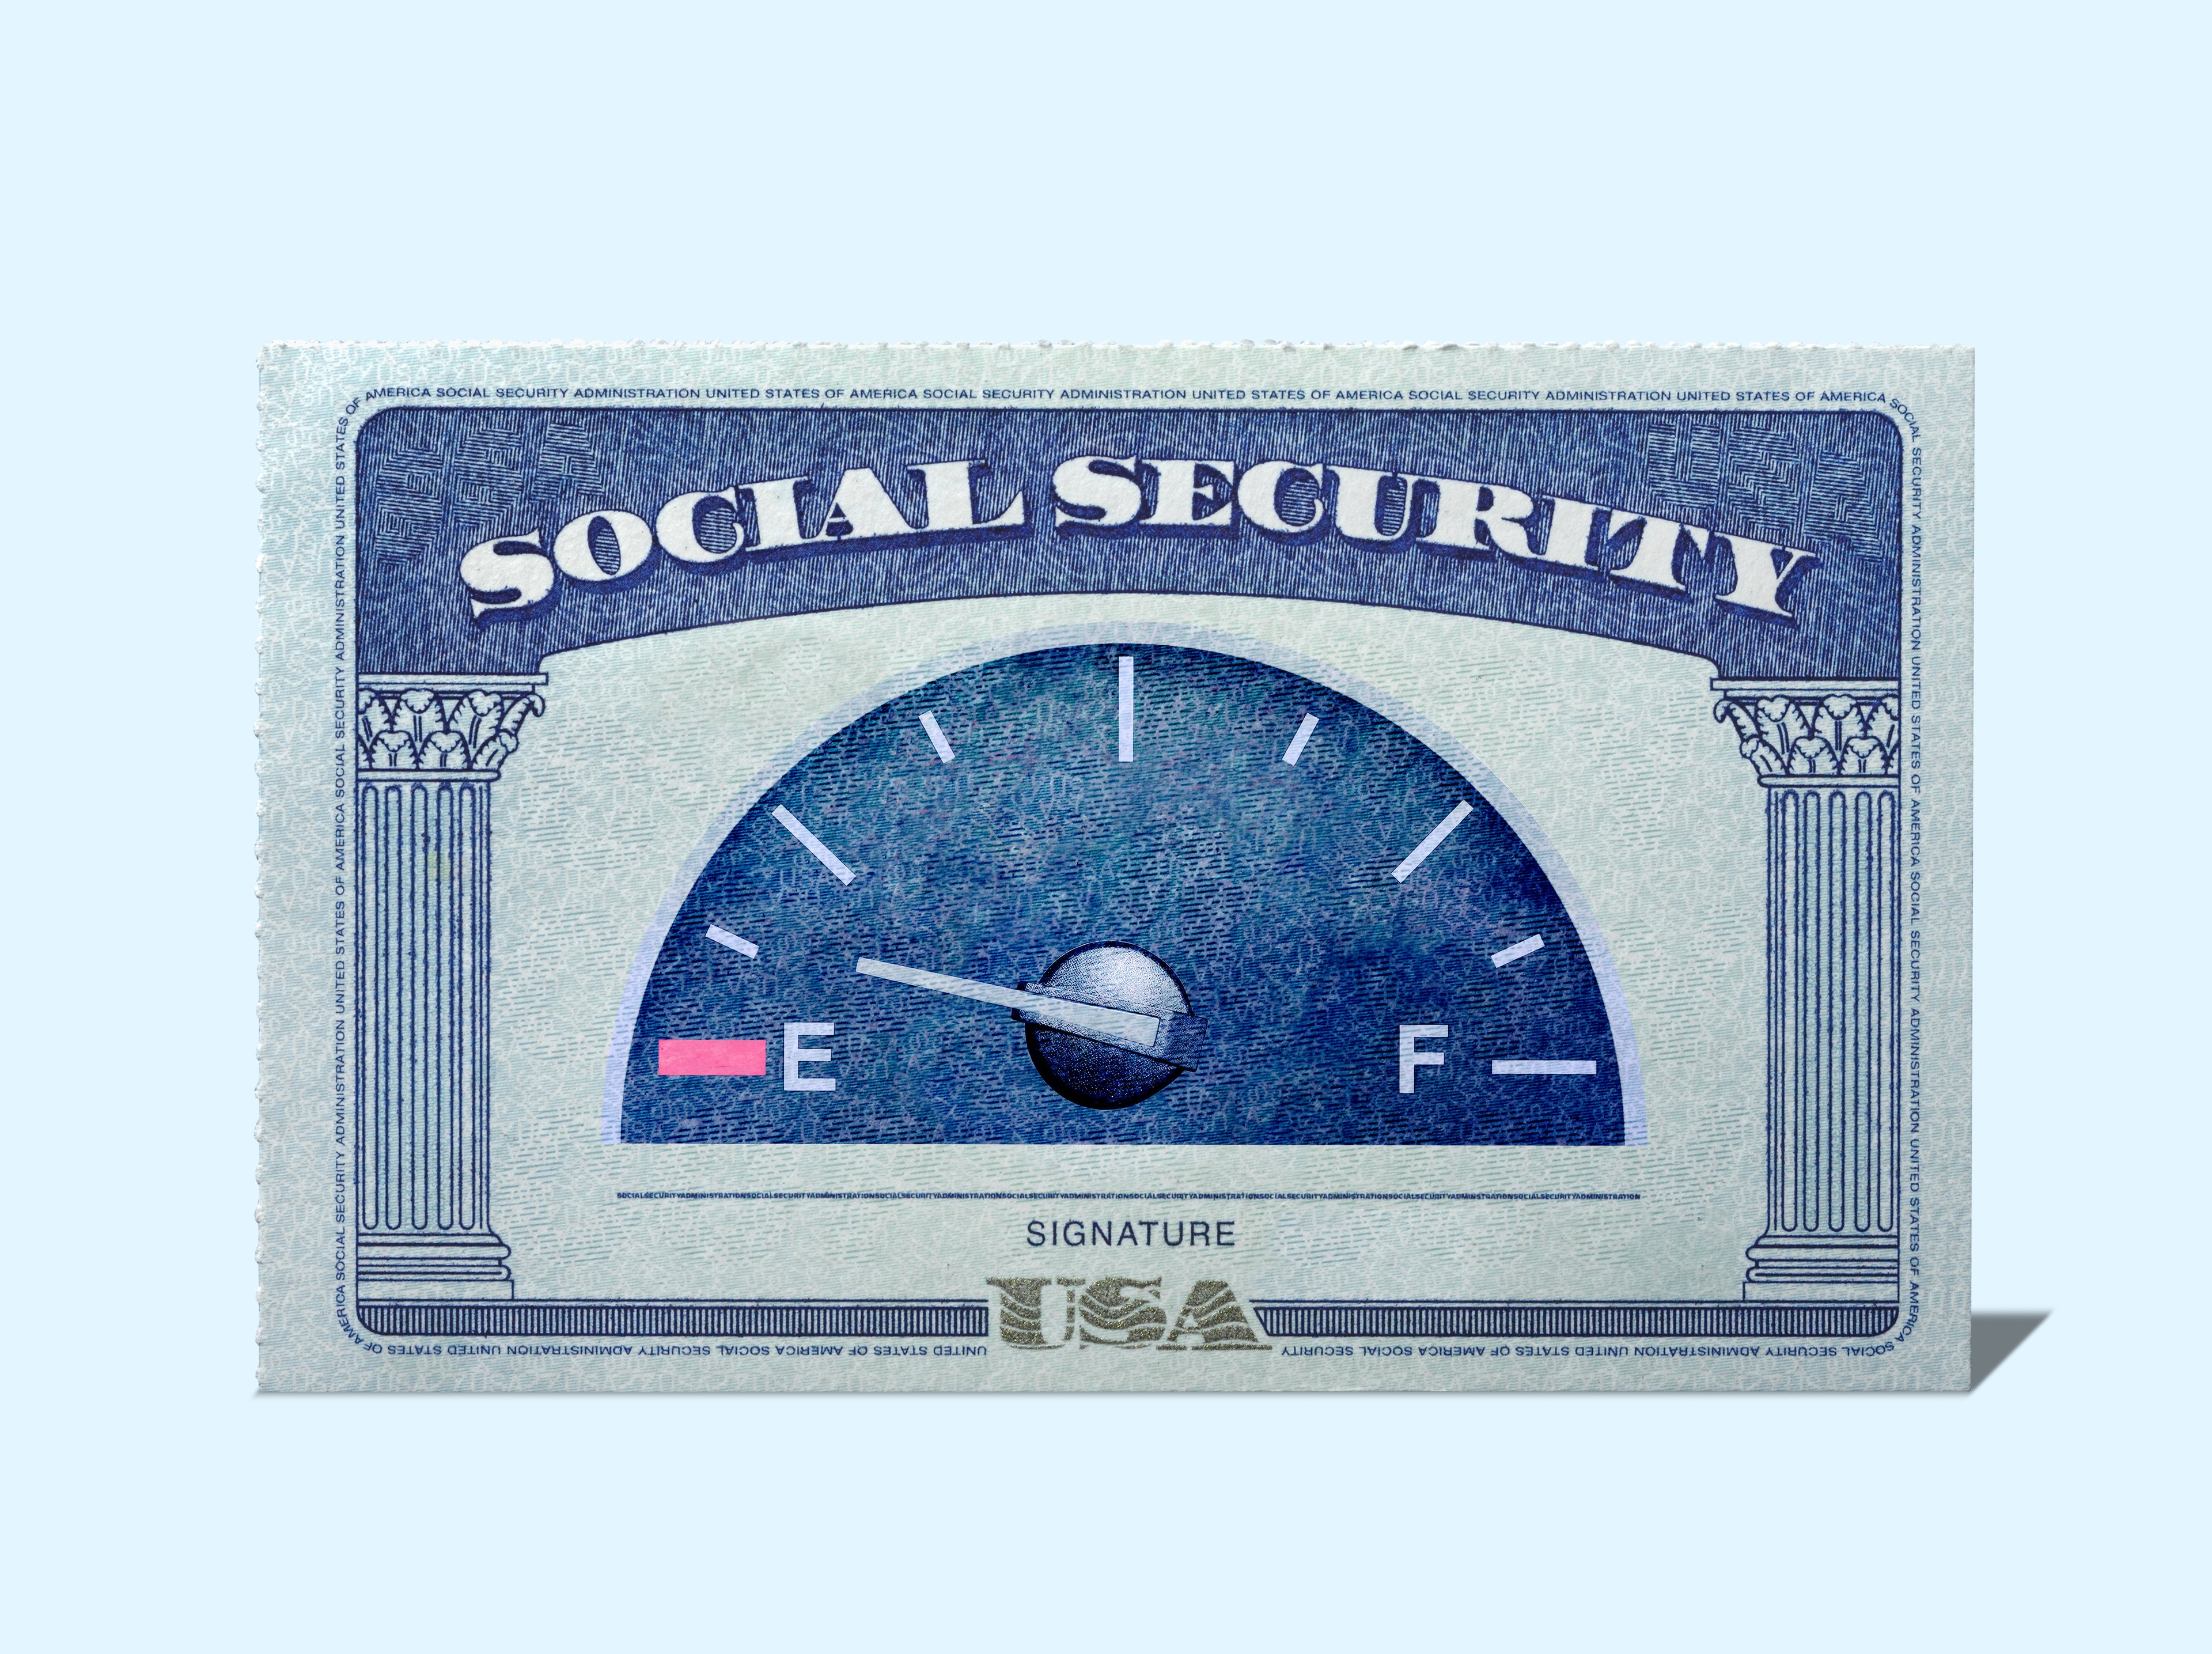
We're now a little more than six years from a potentially devastating Social Security cut that could shrink average checks by nearly a quarter, and workers and seniors alike are rightfully worried. Millions of Americans depend on these benefits to keep themselves afloat and cannot afford to lose any of them.
The estimated 22% cut would reduce the $2,083 average monthly Social Security benefit as of May 2026 to $1,625 per month, a $458 decrease. But some states would see much greater average losses than this number.

Image source: Getty Images.
How much each state would lose if Social Security benefits were cut by 22%
We can't say exactly how much a cut like this would reduce average benefits because we don't know what the cost-of-living adjustments will look like between now and 2032, when Social Security's trust funds are expected to be depleted. But we can take a look at how a 22% cut would affect benefits today to get a rough idea of the impact this move could have on seniors.
The following table breaks down estimated average benefits by state for 2026, along with how much these checks would decrease if benefits were slashed by 22%.
|
State |
Estimated Average Benefit (2026) |
Effect of a 22% Benefit Reduction on Current Checks |
|---|---|---|
|
Alabama |
$1,973.97 |
-$434.27 |
|
Alaska |
$1,960.39 |
-$431.28 |
|
Arizona |
$2,076.07 |
-$456.73 |
|
Arkansas |
$1,903.93 |
-$418.86 |
|
California |
$1,989.34 |
-$437.66 |
|
Colorado |
$2,093.82 |
-$460.64 |
|
Connecticut |
$2,257.64 |
-$496.68 |
|
Delaware |
$2,231.41 |
-$490.91 |
|
Florida |
$2,016.50 |
-$443.63 |
|
Georgia |
$1,978.31 |
-$435.23 |
|
Hawaii |
$2,036.35 |
-$448.00 |
|
Idaho |
$2,006.07 |
-$441.34 |
|
Illinois |
$2,061.12 |
-$453.45 |
|
Indiana |
$2,090.89 |
-$460.00 |
|
Iowa |
$2,047.85 |
-$450.53 |
|
Kansas |
$2,112.71 |
-$464.80 |
|
Kentucky |
$1,918.00 |
-$421.96 |
|
Louisiana |
$1,869.32 |
-$411.25 |
|
Maine |
$1,941.55 |
-$427.14 |
|
Maryland |
$2,199.45 |
-$483.88 |
|
Massachusetts |
$2,142.68 |
-$471.39 |
|
Michigan |
$2,123.88 |
-$467.25 |
|
Minnesota |
$2,153.79 |
-$473.83 |
|
Mississippi |
$1,865.04 |
-$410.31 |
|
Missouri |
$1,990.72 |
-$437.96 |
|
Montana |
$1,939.78 |
-$426.75 |
|
Nebraska |
$2,067.10 |
-$454.76 |
|
Nevada |
$1,959.74 |
-$431.14 |
|
New Hampshire |
$2,244.97 |
-$493.89 |
|
New Jersey |
$2,251.37 |
-$495.30 |
|
New Mexico |
$1,917.34 |
-$421.82 |
|
New York |
$2,074.73 |
-$456.44 |
|
North Carolina |
$2,035.45 |
-$447.80 |
|
North Dakota |
$1,982.53 |
-$436.16 |
|
Ohio |
$1,976.75 |
-$434.89 |
|
Oklahoma |
$1,975.50 |
-$434.61 |
|
Oregon |
$2,045.45 |
-$450.00 |
|
Pennsylvania |
$2,109.76 |
-$464.15 |
|
Rhode Island |
$2,107.21 |
-$463.59 |
|
South Carolina |
$2,052.20 |
-$451.48 |
|
South Dakota |
$1,973.03 |
-$434.07 |
|
Tennessee |
$2,012.83 |
-$442.82 |
|
Texas |
$1,986.12 |
-$436.95 |
|
Utah |
$2,123.01 |
-$467.06 |
|
Vermont |
$2,096.75 |
-$461.28 |
|
Virginia |
$2,121.74 |
-$466.78 |
|
Washington |
$2,158.16 |
-$474.80 |
|
West Virginia |
$1,951.20 |
-$429.26 |
|
Wisconsin |
$2,084.37 |
-$458.56 |
|
Wyoming |
$2,080.20 |
-$457.64 |
Data source: Social Security Administration. Calculations by author.
States with larger average benefits stand to lose the most, but a cut of this magnitude would be difficult for seniors everywhere. They'd be forced to drastically reduce spending or rely more heavily on personal savings, which might not be an option for lower-income workers who struggled to save throughout their careers.
Fortunately, a benefit cut this extreme isn't likely. The government has stepped in to stop Social Security from running out of money before, and it will probably act again this time. But we don't know what the fix will look like yet. It may still involve smaller cuts or increased taxes on workers.
Whatever the changes, they'll almost certainly affect workers and seniors alike. When Congress decides how it's going to fix Social Security, everyone will have to take a hard look at their retirement plans and probably make some changes to ensure they remain financially secure for years to come.