2025 has been an exceptional year for gold and silver, as well as for exchange-traded funds (ETFs) that track these two precious metals. iShares Silver Trust (SLV 1.33%) and SPDR Gold Shares (GLD 1.60%) both provide access to physical precious metals, but differ in underlying commodities, volatility, and cost structures.
SLV is designed to reflect the price of silver, while GLD aims to mirror the price of gold bullion. Both are among the largest and most liquid commodity ETFs, and therefore hugely popular among investors seeking exposure to precious metals without buying physical bullion. But the risk profiles and historical returns of the two ETFs diverge, making them suitable for different types of investors seeking exposure to precious metals.
Snapshot (cost & size)
| Metric | SLV | GLD |
|---|---|---|
| Issuer | iShares | SPDR |
| Expense ratio | 0.50% | 0.40% |
| 1-yr return (as of Dec. 19, 2025) | 126.9% | 66.8% |
| Beta | 1.39 | 0.49 |
| AUM | $34.1 billion | $146.9 billion |
Beta measures price volatility relative to the S&P 500; beta is calculated from five-year weekly returns. The 1-yr return represents total return over the trailing 12 months.
Performance & risk comparison
| Metric | SLV | GLD |
|---|---|---|
| Max drawdown (5 y) | (38.79%) | (21.03%) |
| Growth of $1,000 over 5 years | $2,499 | $2,269 |
What's inside
The SPDR Gold Shares is entirely backed by physical gold, with 100% of the fund's portfolio comprising the precious metal. The ETF has been trading for over 21 years and is recognized as the first US-listed ETF backed by a physical asset. There are no sector tilts or quirks; the fund offers pure exposure to gold prices and is among the largest commodity ETFs in the world.
iShares Silver Trust, on the other hand, is designed to reflect the price performance of silver and is also 100% concentrated in its target commodity. Like GLD, it does not introduce sector or geographic tilts. Given its inception in 2006, SLV is the world's oldest and largest silver ETF.
Both funds are straightforward in their design and provide the easiest way to gain exposure to the prices of precious metals. The difference in the underlying commodity, however, can lead to price swings.
For more guidance on ETF investing, check out the full guide at this link.
What this means for investors
Precious metals have sizzled in 2025. While gold hit all-time highs in October 2025, silver is breaking records even as I write this. Precious metals are considered safe-haven assets and are widely used by investors to hedge their portfolios against uncertainties and inflation, mainly because the values of gold and silver are not tied to a single company or even economy.
Geopolitical tensions, falling interest rates (which make precious metals more attractive compared to bonds), and robust buying by central banks worldwide have all contributed to the surge in gold and silver prices in 2025. Demand for gold is largely driven by central banks and large investors, as well as retail buyers from major markets such as India and China for jewelry purposes. Silver, on the other hand, is an industrials metal, with significant applications in electronics, solar panels, electric vehicles, and medical devices. The market for gold is, therefore, deeper and more liquid, which may explain why silver has historically been a more volatile metal.
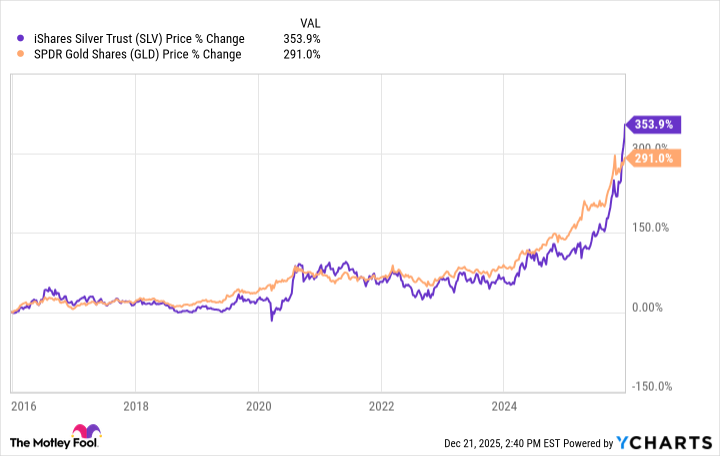
In the long run, though, both metals have generated significant returns for shareholders. Investors can either buy physical bullion, gold and silver stocks, or invest in gold and silver ETFs to benefit from the rise in the prices of the precious metals.
The SPDR Gold Shares ETF and the iShares Silver Trust ETF are your best bets, depending on which metal you are seeking exposure to. Both ETFs invest in physical metals stored in vaults, providing you with direct exposure to their prices. They are also large and liquid funds, and you may consider buying some chares of both ETFs to ride the long-term potential boom in gold and silver prices.
Glossary
ETF: Exchange-traded fund; a pooled investment that trades on stock exchanges like a single stock.
Expense ratio: The annual fee, as a percentage of assets, that a fund charges its investors.
Assets under management (AUM): The total market value of assets a fund manages on behalf of investors.
Beta: A measure of an investment's volatility compared to the overall market, often the S&P 500.
Max drawdown: The largest observed percentage drop from a fund's peak value to its lowest point over a period.
Liquidity: How easily an asset or security can be bought or sold in the market without affecting its price.
Commodity ETF: An ETF that invests in physical commodities, such as gold or silver, rather than stocks or bonds.
Sector tilt: When a fund has a larger allocation to certain industries or sectors than the overall market.
Physical asset: A tangible item, such as gold or silver, held by a fund to back its value.
Total return: The overall gain or loss from an investment, including price changes and income from dividends or interest.