
Image source: iStock/Thinkstock.
Citigroup (C -4.03%) has come a long way since the financial crisis, but there's one thing that's been left behind, at least compared to other bank stocks: its dividend. The good news is that the New York-based bank has begun to make up the difference in this regard.
Citigroup's paltry dividend
There are three metrics you can use to compare one bank's dividend to others: yield, payout ratio, and growth. In Citigroup's case, while it lags in one of these areas, it measures up well in the other two.
Let's start with its dividend yield. The average stock on the S&P 500 yields 2.1%. And among major bank stocks -- the two dozen banks on the KBW Bank Index -- the average yield is even higher, at 2.4%.
Meanwhile, shares of Citigroup yield only 0.65%. That's the lowest among blue chip bank stocks. It also represents a stark departure from a time when Citigroup distributed the equivalent of $5.50 a share each quarter compared to today's $0.16 quarterly per-share payout.
To survive the 2008 crisis, Citigroup was forced to slash its dividend to a token $0.01 per share. And since then, because regulators now have veto power over big bank dividend policies, it's only been able to raise it twice, while banks such as Wells Fargo and JPMorgan Chase have boosted their quarterly distributions every year since 2011.
Based on yield alone, then, Citigroup's current dividend doesn't compare favorably to other bank stocks.
But there's hope...
The good news is that, if you consider the other two metrics used to gauge a specific company's dividend, then Citigroup looks much better.
Take its payout ratio, which measures the percentage of earnings that a company distributes to shareholders each year via dividends. Because Citigroup has only raised its dividend two times in the past eight years, it now pays out a minuscule share of its earnings.
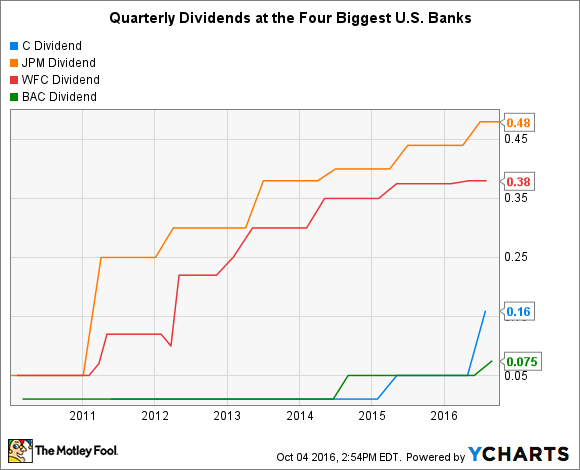
C Dividend data by YCharts.
The typical bank on the KBW Bank Index pays out a third of earnings to shareholders. By contrast, Citigroup distributes only a tenth of its earnings. This means that it has a lot more room to grow its payout relative to most of its peers.
And the same is true when you look at the size of banks' latest dividend increases. The median year-over-year growth in large-cap bank dividends over the past 12 months was 9.3%. That's a fraction of the tripling of Citigroup's dividend this year, going from $0.05 per share up to $0.16 per share.
Indeed, in both of these areas -- payout ratio and recent dividend growth -- Citigroup outperforms every other bank stock on the KBW Bank Index.
The takeaway for investors is that Citigroup's current dividend leaves a lot to be desired, but the bank is nevertheless positioned to remedy its shortcomings in this regard in the years ahead.


