On June 13, Chart Industries Inc. (GTLS +0.00%), a manufacturer of cryogenic gas processing equipment, caught investors off guard when it announced that CEO William Johnson had been terminated after less than two years with the company, and only 13 months as CEO. In the weeks that followed, Mister Market's uncertainty over the move showed, as shares fell more than 15% at one point.
But it seems the company's second-quarter results, announced on July 19, have assuaged those concerns. Shares surged almost 12% on earnings day, and now trade above their pre-CEO firing peak following a successful quarter and updated long-term guidance. Let's look at what's happening with Chart, and how things shape up for the future.

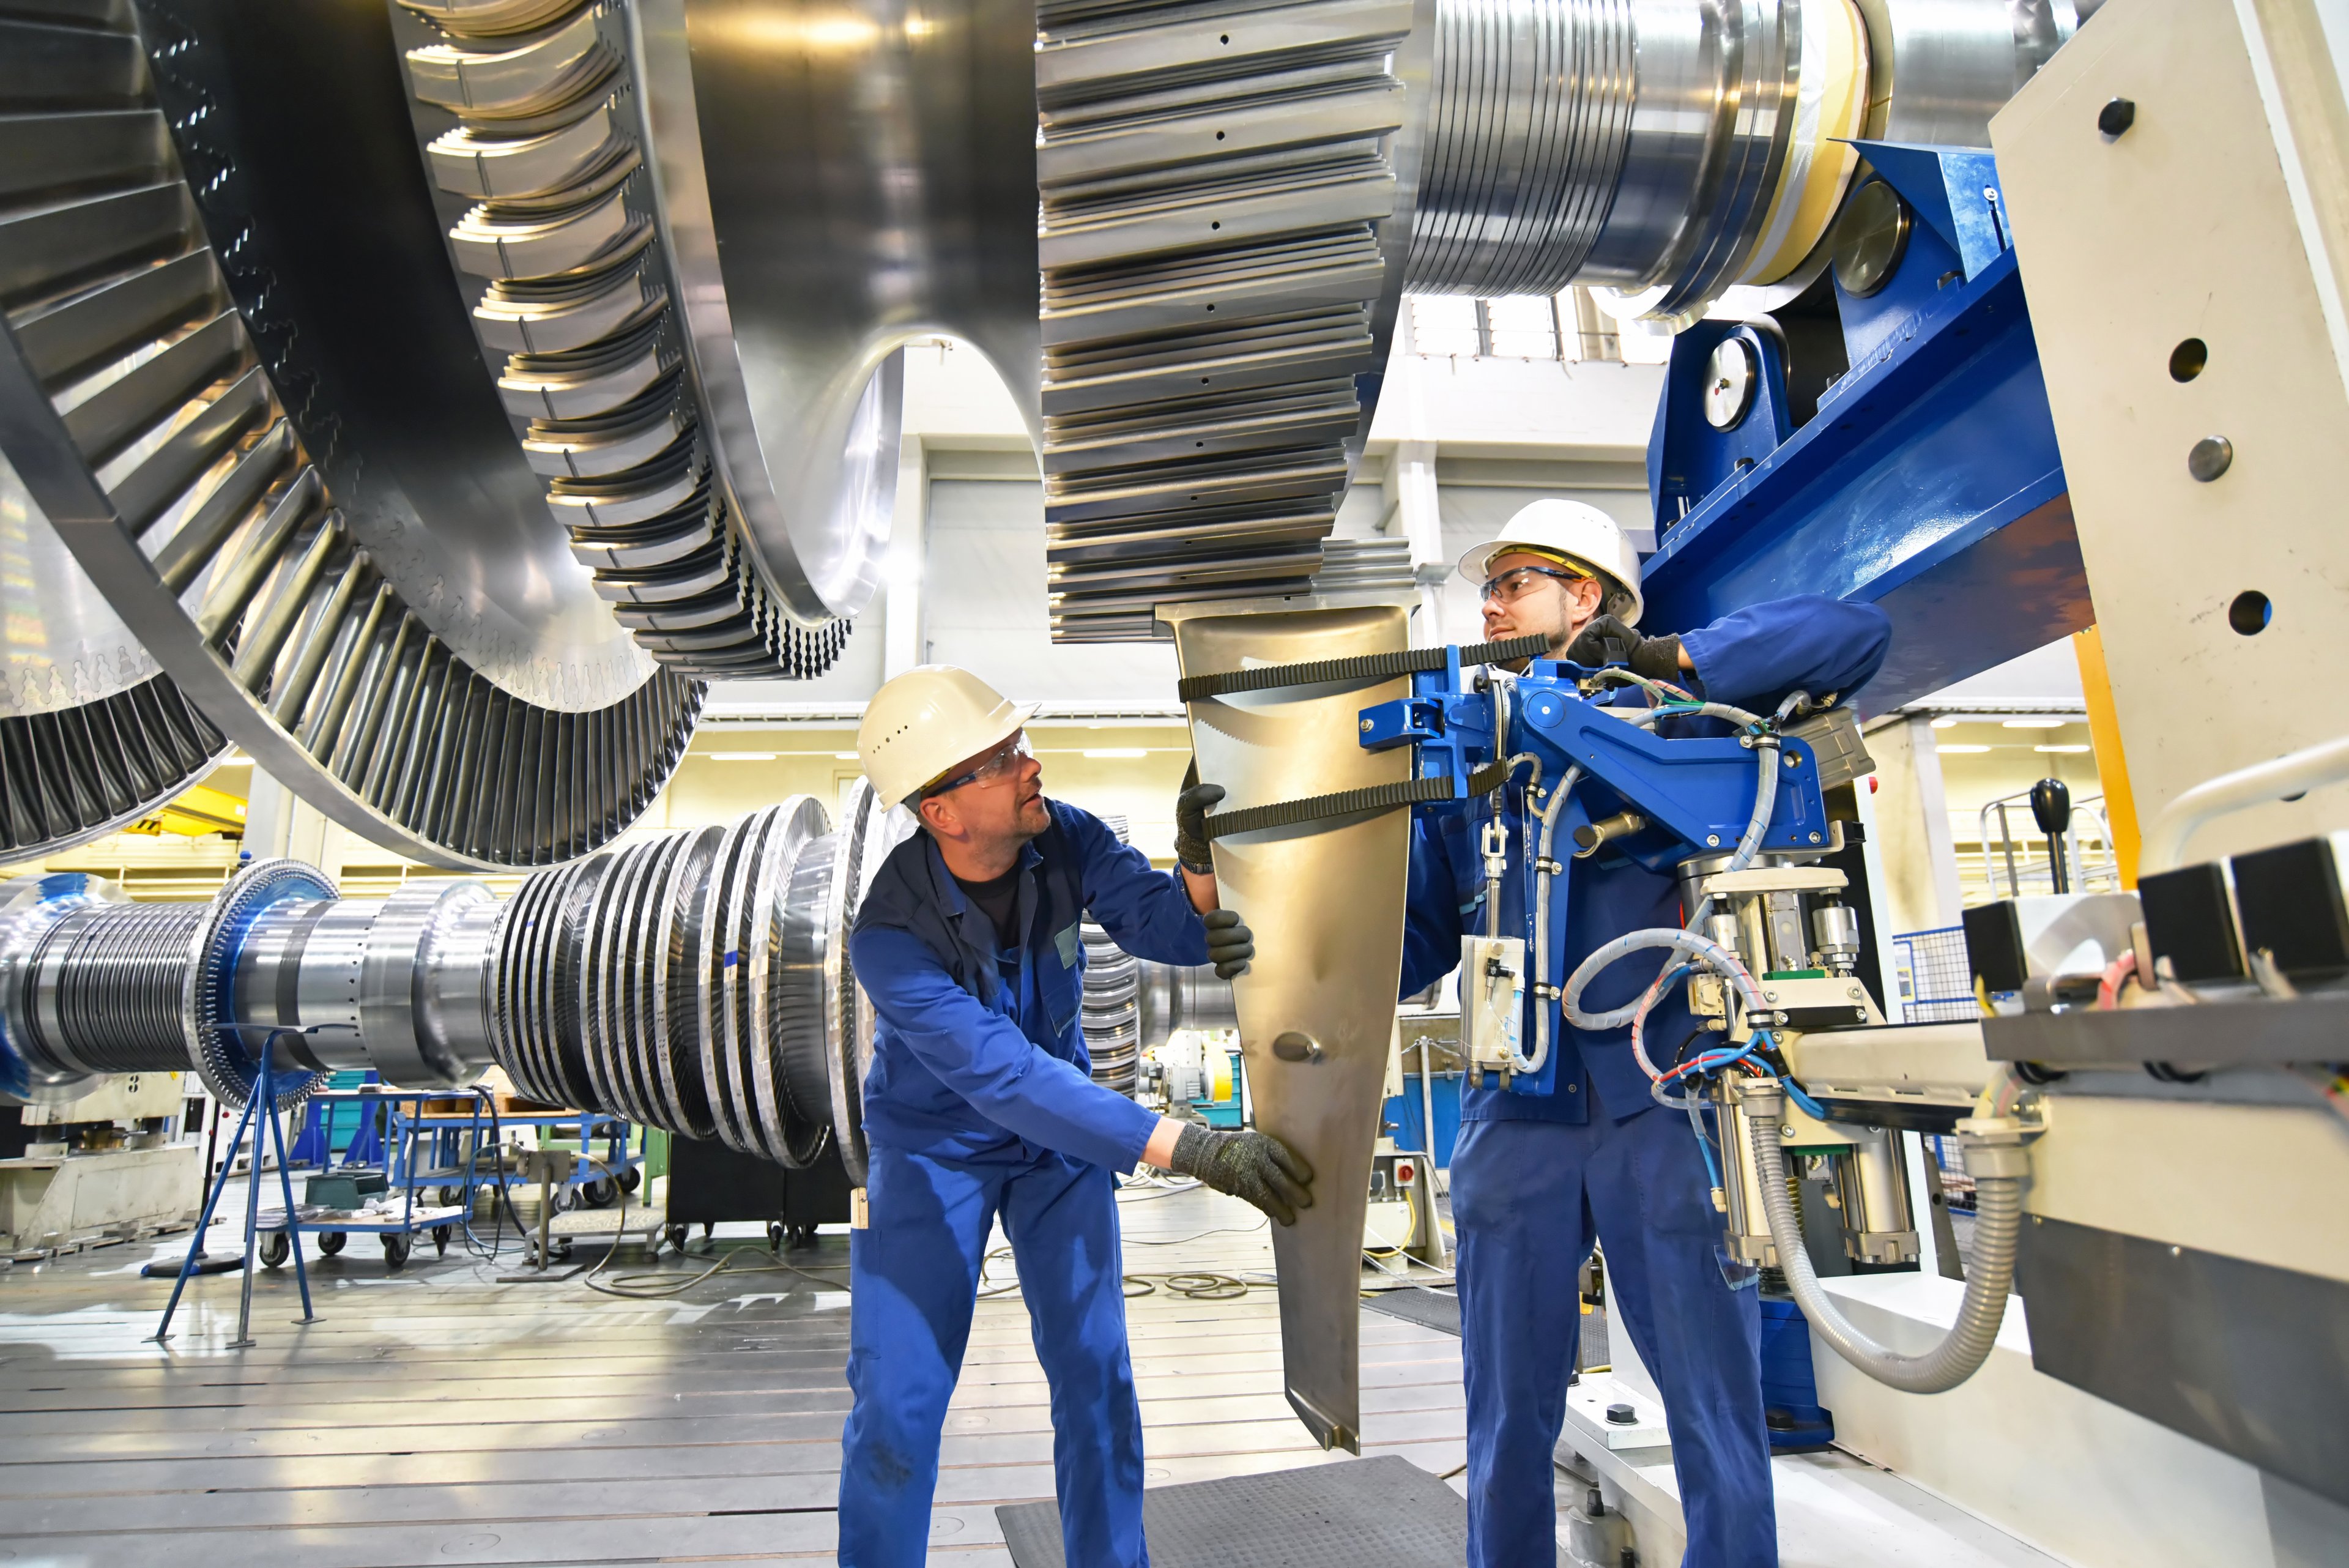
Liquid nitrogen at Chart. Image source: Chart Industries.
A quick look at recent management changes
There has been substantial turmoil in Chart's executive suite over the past three years. Some of it, such as the retirement of longtime CEO Sam Thomas in 2017, was planned for (with the hiring of Johnson in 2016 as his eventual replacement). The company has also seen the departure of several other executives over the past two years, a somewhat expected result of moving its corporate headquarters from Ohio to Georgia last year.
However, the departure of Johnson was very much unexpected and abrupt, though the quick appointment of Jillian Evanko indicates that Chart's board of directors has made succession planning a priority. Evanko, who was named CEO in the same release in which Johnson was announced as being out, has been with Chart since March 2017 as treasurer, chief accounting officer and CFO.
While the company also announced the promotion of two other executives to take on some of Evanko's former roles (treasurer and chief accounting officer), her replacement as CFO has not been named yet.
Business -- and profits -- are picking up
Over the past several years, starting under Thomas, Chart has invested substantial resources to streamline operations and integrate recent acquisitions. The result is a company that's positioned to perform more profitably in both the down cycle and when demand from key end markets, like energy and biomedical, returns to the growth cycle.
Based on the results of the past several quarters, growth in demand is picking up. Chart reported sales of $320 million, up 34% year over year, and a strong 14% higher since the first quarter. Booked orders were $360 million, up 43% from last year and 12% sequentially.
Chart has made a number of acquisitions in recent years, but they aren't the only contributors to sales growth. Chart said that organic sales were up 14%, and organic orders increased 6% in the quarter. This marked a sixth consecutive quarter of sequential order growth. Paired with strong organic growth, that is a positive indicator the demand cycle has returned to growth.
Chart's sales growth paid off with a nice bump in profits. Earnings per share were $0.38, up from $0.09 last year, and more than double the first quarter's $0.18. Chart also provided an adjusted EPS result, which excluded the impact of restructuring spending in the quarter that was completed and won't recur, a one-time charge related to a product recall, and $1.4 million in severance for the departed CEO. On an adjusted basis, EPS would have been $0.55.
An important note on adjusted results: They aren't a replacement for GAAP numbers, but can offer more context when there are unique events and expenses that impact earnings. And in Chart's case, it's certainly helpful to see how these (hopefully) nonrecurring events masked its true profit potential.
Looking ahead: Strong demand is driving profits higher
When Chart reported its first quarter in April, management set guidance for full-year EPS of $1.75 to $2 on an adjusted basis, which was an increase from its prior 2018 guidance of $1.65 to $1.90, set following its fourth-quarter earnings release. After another successful quarter of solid sales and order growth, management once again raised the bar, and now expects adjusted 2018 EPS of $1.85 to $2.05, on sales of $1.2 billion to $1.25 billion.
Chart's order backlog also continues to grow, passing $527 million at quarter-end, up nearly $40 million in three months, and $160 million higher than it was one year ago. This is further indication that the worst of the energy downturn, which created substantial drag on demand for Chart, is in the rearview mirror.
Furthermore, Chart's efforts to expand its recurring revenues are paying off. Parts, repair, service, and aftermarket items now account for 13% of sales, up from single digits a few years ago. And on the earnings call, Evanko said that management expects they will account for over 20% of Chart's sales in three years. Not only will this drive higher sales and earnings as the business grows, but it will also pay dividends during the next down cycle, as companies often spend more on maintenance and service to defer equipment replacement in that part of the cycle.
Add it all up, and Chart is executing well on its strategy, and is set to drive profits steadily higher as demand from end-use markets grows.