Warren Buffett is widely considered one of the greatest investors of all time. The secret to his success isn't trying to time the market. "We try to price, rather than time, purchases," Buffett wrote in 1994 letter to Berkshire Hathaway shareholders.
That means Buffett will buy if, and only if, an equity offers great value relative to the business. And if the market wants to pay a premium for a stock, he's happy to sell it to them. That ensures Buffett remains mostly on the sidelines when stocks start getting expensive.
There are many tools to determine if a business trades at a price above or below its intrinsic value. But right now, one market indicator, dubbed the Buffett Indicator, is flashing a big red warning sign that the entire market may be overvalued.

Image source: The Motley Fool.
A new record for the Buffett Indicator
Warren Buffett wrote an article for Fortune in 2001 showing how the stock market can occasionally become highly irrational. He detailed an interesting ratio that zoomed higher and higher ahead of the dot-com bubble popping in 2000. It's the total market value of all publicly-traded securities as a percentage of gross national product. Today, it's known as the Buffett Indicator.
That indicator ramped up rapidly in the late '90s before it peaked at 190% in 2000, just ahead of the dot-com bubble popping. Earlier this month, the ratio hit a new record, 210%.
But it's not the first time the indicator has climbed past its dot-com-era peak. The ratio also surpassed 190% in late 2021, just ahead of the 2022 bear market. The market surpassed those highs in late 2024 and have stayed elevated (save for a few months earlier this year) ever since.
Buffett certainly appears to think stocks are getting expensive. He's sold more stocks than he bought in each of the last 10 quarters, netting $174 billion in total stock sales in that time. Over the last year, he's even stopped repurchasing shares of Berkshire Hathaway, suggesting he finds his own company's stock price above its intrinsic value. Meanwhile, Berkshire's cash balance has climbed to a whopping $348 billion.
But before investors panic and sell everything, there are a few important details to know.
Why the Buffett Indicator keeps climbing
There are several explanations for why market valuations have climbed higher relative to GNP over the last 25 years:
- Interest rates: Buffett explains the power of interest rates in that 2001 Fortune article. "The tiniest change in rates changes the value of every financial asset," he wrote. For most of the last 15 years, we've had extremely low interest rates. That said, interest rates have been higher in recent years, but the long-term interest rates remain historically low. With low interest rates, investors are willing to accept lower returns from stocks, pushing valuations higher.
- Growing adoption of investing: The percentage of households holding stocks peaked at 38.7% in 2000. That fell to less than 20% at the bottom of the market in 2009. Today, 43.1% of households hold stocks. With more Americans putting some of their savings into stocks, total market cap can climb faster than gross national product.
- Growing foreign investment in U.S. equities: The stock market has become global, and U.S. stocks have seen huge amounts of capital poured into them by foreign investors. As of June 2024, foreign entities held $17 trillion worth of U.S. stocks. That's 10 times the amount held in 2000. In 2024, foreign investors accounted for over 30% of the entire Wilshire 5000 Total Market Index market cap, versus less than 12% in 2000. With more foreign investors piling money into U.S. stocks, the market cap should increase faster than U.S. GNP.
However, the last two factors have moved in the wrong direction recently. Total American households holding equities dropped in the first quarter. Additionally, it appears many foreign investors are pulling money out of U.S. securities following President Trump's planned tariffs announcement. That should give investors some pause when looking at the current market.
Is the stock market about to crash?
The Buffett Indicator is simply a measure of where valuations stand at the moment. It doesn't necessarily predict an impending crash. As mentioned, there are all sorts of reasons for valuations to climb higher. Still, the elevated Buffett Indicator suggests a decline in stock values is more likely than on average.
Buffett is more than willing to sit on the sidelines when nothing looks attractive. If you can maintain patience in times when every stock is increasing in value, you'll have plenty of opportunities to buy when stock prices come back down -- whether that's a year from now or five years from now.
In the meantime, though, there are some areas of the market that look more attractive than others. One more reason the Buffett Indicator has climbed over the last decade is the dominance of a handful of megacap companies. Smaller stocks trade at a relatively low valuation.
In fact, small-cap stocks proved to be a great investment amid the peak of the dot-com bubble. They mostly avoided the big dot-com bubble sell-off, and the small-cap S&P 600 index went on to outperform the large-cap S&P 500 (^GSPC +0.46%) over the next decade.
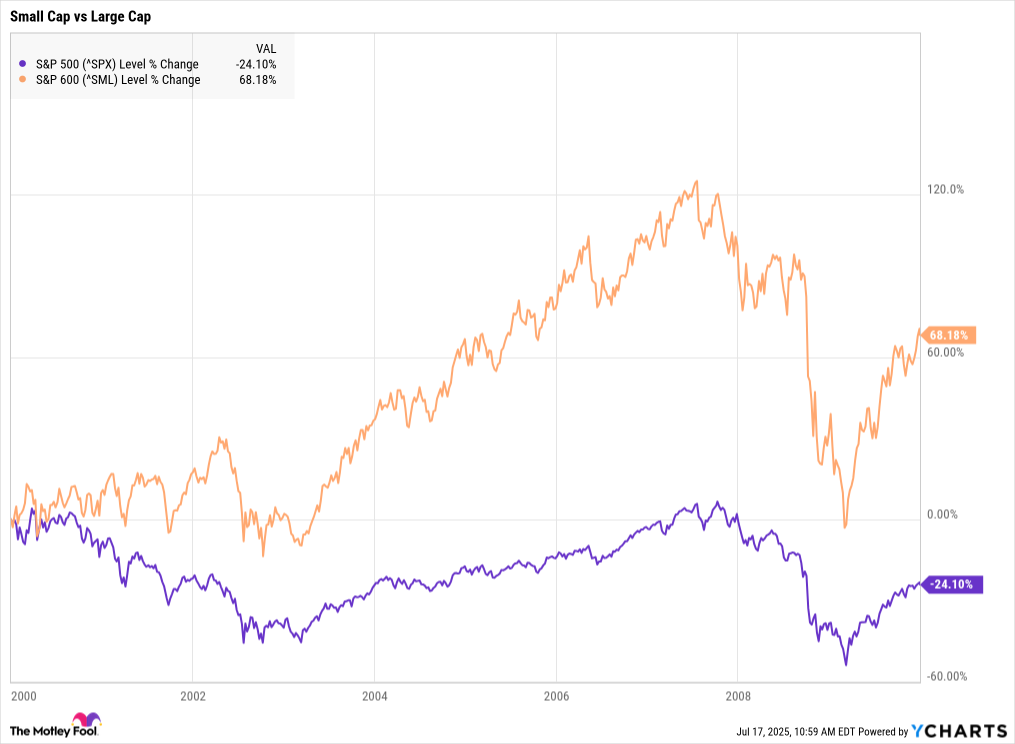
Data by YCharts.
Taking the time to find great value stocks amid small- and medium-sized companies could be one of the best ways to guard against high valuations in this market and ensure you preserve capital in case of a downturn.