Though volatility is a given when investing on Wall Street, these ebbs-and-flows can be more pronounced in certain years.
Since 2025 began, the benchmark S&P 500 (^GSPC 0.84%) endured its fifth-steepest two-day percentage decline since 1950, its largest single-session point increase since its inception, and one of its strongest three-month gains in the past 75 years.
The rip-roaring comeback of the S&P 500, Nasdaq Composite (^IXIC 1.43%), and Dow Jones Industrial Average (^DJI 0.34%) following a tariff-induced swoon in late March and early April has lifted the spirits of investors. Unfortunately, it's also sent stock valuations to rarely before-witnessed levels.

Image source: Getty Images.
Although the stock market is historically pricey, which usually portends short-term trouble for investors, there's one high-yield exchange-traded fund (ETF) that makes for a genius buy right now. Investors, say hello to the Schwab U.S. Dividend Equity ETF (SCHD +1.67%).
A historically expensive stock market portends trouble for Wall Street
Before digging into the details of why the Schwab U.S. Dividend Equity ETF makes for such a smart buy, the groundwork needs to be laid explaining why trouble is likely brewing for Wall Street. Understanding historical precedent will help you realize why this ETF makes for such a surefire buy.
To state the obvious, "value" is a subjective term. What you believe is a pricey or overvalued might be viewed as a bargain by another investor. This difference of opinion for what constitutes value is what makes the stock market so unpredictable.
Traditionally, the price-to-earnings (P/E) ratio has been the go-to for investors when valuing stocks. The P/E ratio is arrived at by dividing a company's share price by its trailing-12-month (TTM) earnings per share (EPS). Normally, the lower the P/E ratio, the more attractive a company's valuation is believed to be (but there are other factors to consider).
The shortcoming of the P/E ratio is that it only takes 12 months of EPS history into account. This means recessions and shock events can make this valuation measure fairly useless. This is where the S&P 500's Shiller P/E ratio comes into play. You may also see the Shiller P/E referred to as the cyclically adjusted P/E ratio (CAPE ratio).
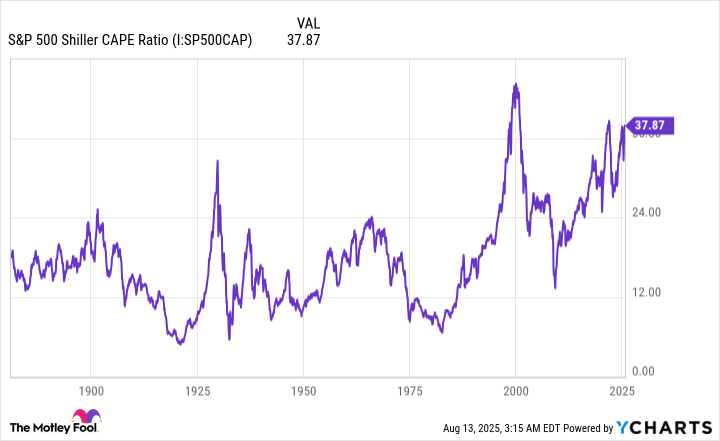
S&P 500 Shiller CAPE Ratio data by YCharts.
The Shiller P/E is based on average inflation-adjusted EPS over the prior 10 years. Inflation-adjusting ensures an apples-to-apples comparison when back-testing, while examining a decade of EPS history minimizes the impact of short-lived recessions and shock events.
When back-tested to January 1871, the S&P 500's Shiller P/E has averaged a multiple of 17.27. As of the closing bell on Aug. 12, it's nearly at 39. The only two continuous bull markets with higher Shiller P/E readings occurred during the first week of January 2022 (just above 40), and in December 1999, just months before the bursting of the dot-com bubble (peaked at a multiple of 44.19).
Since 1871, there have only been six instances where the S&P 500's Shiller P/E surpassed and held 30 for at least a two-month period, including the present. Following the prior five occurrences, the S&P 500, Dow Jones, and/or Nasdaq Composite lost anywhere from 20% to 89% of their respective value on a peak-to-trough basis. While the 89% drop, which correlated with the Great Depression, represents an anomaly, the important takeaway is that extended valuation premiums aren't tolerated over long periods.
If history were to rhyme, yet again, at some point in the not-too-distant future, the aggressively valued growth stocks responsible for powering the current bull market higher would, in all likelihood, be hit the hardest. This includes Wall Street's leading artificial intelligence (AI) and quantum computing stocks, as well as public companies benefiting from crypto euphoria.

Image source: Getty Images.
The Schwab U.S. Dividend Equity ETF makes for a genius buy
With a better understanding of what history suggests is coming, let's dive into the various reasons why the Schwab U.S. Dividend Equity ETF is worth buying.
To begin with, dividend stocks have a knack for outperforming non-payers over the long run. Though growth stocks have been the fuel powering the S&P 500 and Nasdaq Composite to new heights, it's income stocks that have consistently delivered for investors.
In The Power of Dividends: Past, Present, and Future, the analysts at Hartford Funds, in collaboration with Ned Davis Research, compared the performance of dividend stocks to non-payers over 51 years (1973-2024). Their analysis found that dividend stocks handily outperformed the non-payers on an annualized return basis -- 9.2% for dividends stocks vs. 4.31% for non-payers. Furthermore, the income stocks were noticeably less volatile than the non-payers.
Secondly, the Schwab U.S. Dividend Equity ETF is comprised of 103 public companies that offer competitive advantages and have all been time-tested. For instance, the top three holdings by percentage weighting are Chevron, Altria Group, and PepsiCo (as of Aug. 12):
- Chevron is one of the world's largest integrated energy companies that can lean on its drilling operations, pipelines, or refineries to bolster its operating cash flow.
- Altria is America's leading tobacco company and the parent of the Marlboro brand. Smokers have demonstrated a willingness to eat significant price hikes.
- PepsiCo sells beverages and snacks, which are basic necessities that are going to be purchased in any economic climate.
The point being that the companies held by the Schwab U.S. Dividend Equity ETF generate highly predictable operating cash flow and have previously demonstrated their ability to navigate economic downturns.

NYSEMKT: SCHD
Key Data Points
Valuation is the third reason this ETF is an exceptionally smart buy. Whereas the Shiller P/E is sporting its third-priciest multiple during a continuous bull market when looking back more than 150 years, the TTM P/E ratio for the Schwab U.S. Dividend Equity ETF, as of the end of July 2025, was roughly 17. If the S&P 500, Nasdaq Composite, and Dow Jones Industrial Average were to roll over, the relatively inexpensive and mature businesses comprising this ETF would, presumably, limit your investment downside.
The market-topping yield you'll net is the fourth catalyst for owning the Schwab U.S. Dividend Equity ETF. Whereas the benchmark S&P 500 yielding just 1.2%, as of the closing bell on Aug. 8, this ETF is sporting a 3.87% yield.
Building on this point, the net expense ratio for the Schwab U.S. Dividend Equity ETF is minuscule. The net expense ratio covers the management fees and expenses (e.g., marketing) you'll pay, and totals just 0.06% for this ETF. In other words, only $0.60 of every $1,000 invested annually goes toward these fees.
Amid a historically pricey stock market, the Schwab U.S. Dividend Equity ETF offers the ideal mix of high yield, low fees, potential downside protection, and ample upside reward.