When it comes to stock market indexes, none is as followed (and arguably important) as the S&P 500. Tracking 500 of America's largest and most influential companies, the S&P 500 serves as the primary benchmark for tracking performance in many cases. Outperform the S&P 500, and you did well; underperform the S&P 500, and the results are disappointing.
There's no way to predict how stocks or exchange-traded funds (ETFs) will perform, but there's one Vanguard ETF in particular that I'm confident can outperform the S&P 500 in 2026: The Vanguard Growth ETF (VUG +1.89%). Year to date, VUG's 16% gain has outpaced the S&P 500's 13.5% return.
Given the companies leading the way and their growth prospects, I'm confident that the momentum for this ETF can continue.

Image source: Getty Images.
Top tech companies are leading the charge
The Vanguard Growth ETF tracks the CRSP US Large Cap Growth Index, which includes companies that make up the top 85% of the total market cap of American companies. This works out to 160 companies, with 62% of them being technology companies.
Since the Vanguard fund and S&P 500 are both weighted by market cap, larger companies account for more of the ETF than smaller ones, so there's a lot of overlap at the top between the two portfolios. Of the top 10 holdings in VUG and the S&P 500, nine are shared. Below is how much each accounts for in both the ETF and index:
| Company | Percentage of VUG | Percentage of S&P 500 |
|---|---|---|
| Nvidia | 12.01% | 7.95% |
| Microsoft | 10.70% | 6.73% |
| Apple | 10.47% | 6.60% |
| Alphabet (both classes) | 6.77% | 4.46% |
| Amazon | 5.55% | 3.72% |
| Broadcom | 4.26% | 2.71% |
| Meta Platforms | 4.22% | 2.78% |
| Tesla | 3.70% | 2.18% |
Source: Vanugard. Percentages as of Sept. 30.
This overlap is largely why VUG has outperformed the S&P 500 over the years. These have been some of the best-performing stocks on the market, and since they account for more of VUG than the S&P 500 (around 57% versus 37%), they've been able to push the ETF's gains further. Here is how they've each performed over the past decade:
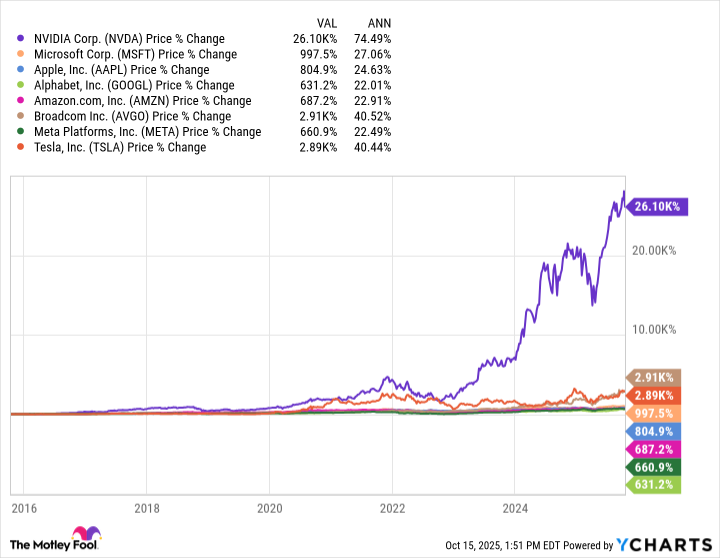
A history of outperforming the S&P 500
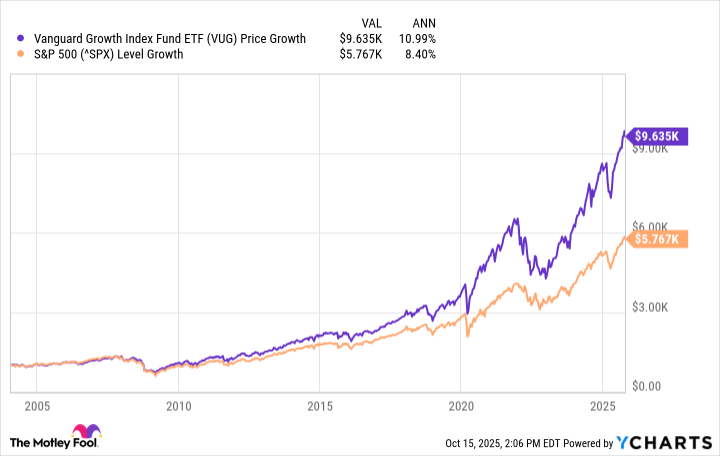
Since VUG hit the stock market in January 2004, it has outperformed the S&P 500 every year. In that span, VUG has averaged 11% annual returns, while the S&P 500 has averaged around 8.4% annual returns.
That difference may look relatively small on paper, but with the compound effect, it makes a real difference in how much someone would have made investing in each. Below is how much $1,000 invested in each at VUG's inception would be worth today:
VUG's growth prospects remain strong
Past performance doesn't guarantee future performance, but considering the main companies leading the S&P 500 also lead VUG (but with more weight), the ETF is well-positioned to continue outperforming the market. The main growth driver that gives me confidence that it can continue is the current artificial intelligence (AI) boom and the role these companies play in the ecosystem.
Nvidia is the main graphics processing unit (GPU) provider for data centers that are important to training and scaling AI; Broadcom supplies key AI-networking hardware; Microsoft, Amazon, and Alphabet have a stronghold on cloud computing services; Apple has admittedly lagged behind in AI but still has a stronghold on tech hardware; Meta's advertising business is strengthening because of AI; and Tesla has its eyes set on using AI for autonomous driving.

NYSEMKT: VUG
Key Data Points
Admittedly, the high concentration in these stocks that has driven much of VUG's growth can also be the reason for its underperformance if its largest holdings turn south. This would also negatively affect the S&P 500, but not nearly as much because it's more diversified across sectors.
The high concentration would cause me to pause in making VUG the bulk of my stock portfolio, but it can be a staple piece that should continue to outperform the S&P 500 in 2026.


