The year 1871 isn't exactly the most noteworthy in American history. Six years after the American Civil War ended, the year was mostly defined by efforts to rebuild the South and by some civil rights legislation.
For investors, however, 1871 is significant for a big reason. It marks the starting point in economist Robert Shiller's U.S. stock market dataset, the same historical record that underpins the Shiller price-to-earnings (P/E) measure, better known as the CAPE ratio.

Image source: Getty Images.
The Shiller P/E ratio takes the price of a broad index like the S&P 500 and measures it against that index's average inflation-adjusted earnings per share from the prior decade. By using a decade of earnings, it can give a picture that isn't distorted by an unusually strong (or weak) year. All in all, it aims to give investors an idea of whether the index currently trades at a discount, or a premium.
The Shiller P/E has a reputation for flashing red when exuberance appears to be leading the market over fundamentals. It was how Shiller himself predicted the dot-com bubble in his book Irrational Exuberance just before the bubble popped in March 2000.
Now, in January 2026, the Shiller P/E of the S&P 500 has climbed into a range similar to the dot-com era's. That alone has made a growing crowd of investors feel very apprehensive.

SNPINDEX: ^GSPC
Key Data Points
What the Shiller P/E is signaling right now
Historically, the S&P 500 has maintained a Shiller P/E in the double-digit range, usually between 12 and 24. Only twice has it risen above 40. The first time was in 1999 and 2000, at the peak of the dot-com bubble, during which the Shiller P/E went above 44 before the bubble popped.
The second time happened in 2025. After three consecutive years of double-digit gains, during which the S&P 500 rose more than 78%, the Shiller P/E has entered a range of about 39 to 40. It continues to maintain that range in 2026.
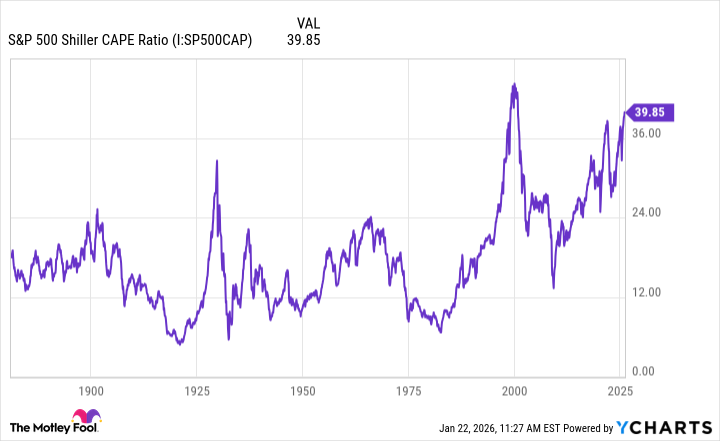
S&P 500 Shiller CAPE Ratio data by YCharts.
As can be seen in the chart above, the Shiller P/E has only surged this quickly twice -- once in the 1920s, and again in the 1990s. In both cases, the market peaked, then crashed hard. The similarity between those periods and today is concerning, and it's why some investors have been thinking twice about the stocks they pick.
Of course, the Shiller P/E doesn't guarantee that history will repeat itself, nor that the market, if is heading for correction, will top out and fall in 2026.
What it does suggest, however, is that now, more than ever, investors should be picky. This is a market that will likely reward companies with strong balance sheets, proven business models, and durable earnings. Likewise, it's also a good time to be skeptical of highly speculative stocks -- especially pre-revenue companies -- that may not survive a steep sell-off.
Investors who stick to high-quality businesses, and stay patient throughout, should be well positioned, regardless of whether a sell-off hits in 2026 or later.