On Feb. 5, mouse-eared media mastodon Walt Disney (NYSE: DIS) released first-quarter earnings for the period ended Dec. 29, 2007. (For background, check out Rick Munarriz's take on Disney's quarter, including why the EPS decrease is deceiving.)
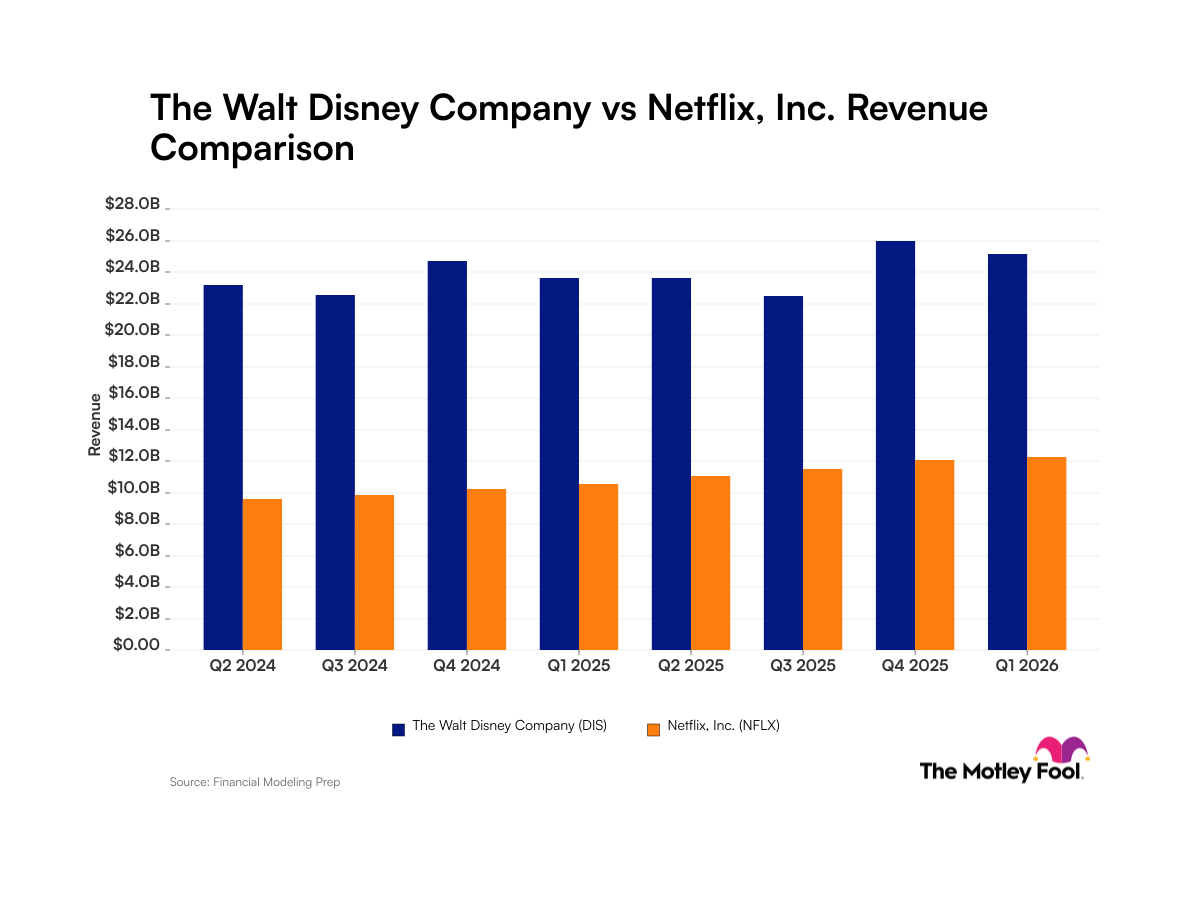
- As always, Disney's biggest moneymaker was the media networks segment, with 40% of the operating income. Parks and movies ran neck-and-neck at about 23% each, and consumer products accounted for 14% of the profits.
- Every reportable segment grew sales by at least 10% compared to the year-ago quarter, and operating income by 25% or more. Well, all except one.
- That would be the filmed entertainment division, where revenue was flat and income was down 15%. The film slate and DVD release schedule this holiday season were pretty good, but they just couldn't measure up to last year's smash hits.
(Figures in millions, except per-share data)
Income Statement Highlights
|
Q1 2008 |
Q1 2007 |
Change | |
|---|---|---|---|
|
Sales |
$10,452 |
$9,581 |
9.1% |
|
Net Profit |
$1,250 |
$1,701 |
(26.5%) |
|
EPS |
$0.63 |
$0.79 |
(20.3%) |
|
Diluted Shares |
1,989 |
2,148 |
(7.4%) |
Get back to basics with the income statement.
Margin Checkup
|
Q1 2008 |
Q1 2007 |
Change* | |
|---|---|---|---|
|
Operating Margin |
19.5% |
17.5% |
2.0 |
|
Net Margin |
12% |
17.8% |
(5.8) |
Margins are the earnings engine.
Balance Sheet Highlights
|
Assets |
Q1 2008 |
Q1 2007 |
Change |
|---|---|---|---|
|
Cash + ST Invest. |
$3,414 |
$2,437 |
40.1% |
|
Accounts Rec. |
$6,994 |
$6,313 |
10.8% |
|
Inventory |
$731 |
$1,185 |
(38.3%) |
|
Liabilities |
Q1 2008 |
Q1 2007 |
Change |
|---|---|---|---|
|
Accounts Payable + Accrued Liabilities |
$7,084 |
$6,916 |
2.4% |
|
Long-Term Debt |
$12,785 |
$10,629 |
20.3% |
The balance sheet reflects the company's health.
Cash Flow Highlights
|
Q1 2008 |
Q1 2007 |
Change | |
|---|---|---|---|
|
Cash From Ops. |
$662 |
$492 |
34.6% |
|
Capital Expenditures |
$249 |
$245 |
1.6% |
|
Free Cash Flow |
$413 |
$247 |
67.2% |
|
$1,386 |
$778 |
78.1% |
Free cash flow is a Fool's best friend.
Competitive Context
|
Market Cap |
Trailing P/E Ratio |
CAPS Rating | |
|---|---|---|---|
|
News Corp. (NYSE: NWS) |
$61,270 |
18.8 |
*** |
|
Walt Disney |
$56,622 |
13.4 |
**** |
|
Time Warner (NYSE: TWX) |
$55,665 |
12.4 |
*** |
|
Carnival (NYSE: CCL) |
$34,075 |
13.8 |
*** |
|
Marvel Entertainment (NYSE: MVL) |
$2,247 |
19.5 |
**** |
Using the latest reported numbers from Capital IQ. Keep your partners close and the competition in your vest pocket.
Related Foolishness: