
Risk and banking seem to have become synonymous as of late. However, does attempting to avoid risk make one any less prone to it?
Today, we'll to dig into that very question by comparing U.S. Bancorp's (USB +0.92%) loan portfolio to other major banks' to decide the importance of:
- Interest-bearing assets
- Diversifying loans
- Return on earning assets
Ultimately, by putting a slightly different twist on a commonly used financial metric, we can cut to the core of the issue and take one more step toward better understanding banks.
Why NII Matters
Net interest income (NII) is the difference between revenue created by interest-bearing assets and interest payments on liabilities. Put more simply, NII is how much money a bank generates through loans, mortgages, and securities.
$11 billion of U.S. Bancorp's $20.2 billion in total revenue in 2012 can be accounted for by NII -- that's whopping 54% of U.S. Bancorp's revenue! Though, this seems to be pretty common among banks. NII accounts for 50% and 61% of Wells Fargo (WFC +2.31%) and PNC's (PNC +2.47%) total revenue, respectively.
Distribution of Loans
It's easy to assume a bank's portfolio is similar to any other portfolio, however, while in some ways it is, whether or not a bank should be diversified in its loan distribution is a matter for serious debate.
However, as a shareholder -- or potential shareholder -- your attention is better focused on how the company currently diversifies its loans and whether it has, or has made plans to, further diversify.
This is because different loans carry varying amounts of risk and reward. For instance, credit card loans carry big risk but pay double-digit interest rates, whereas home loans with a very low LTV are safer and lower yield.
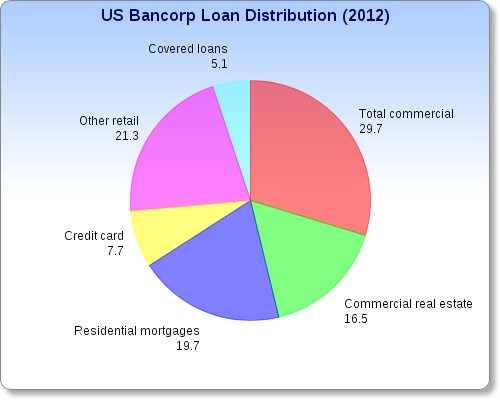
Source: U.S. Bancorp 2012 annual report.
At a glance, U.S. Bancorp looks well balance, but more importantly, while the volume of loans have steadily increased over the past five years, the balance of the portfolio has stayed in tack.
Though, not all banks are distributing loans as evenly as U.S. Bancorp. Nearly 58% of PNC's loan distribution is made up of commercial lending, up 3%, or approximately $20 billion, accounting for nearly all of the variance in total loans from 2011-2012.
A twist on a common metric
Return on assets (ROA) is one of the more commonly used financial metrics to assess how well a company is using its assets to create income. However, ROA accounts for income generated by non-interest bearing assets, and at least for the time being, we're not interested in that.
Although, if instead of using net income, we substitute NII, then divided that number by average earning assets -- interest-producing investments -- we can arrive at the return on average earning assets.
In 2012, there was a return on earnings assets of 3.5% for both U.S. Bancorp and Wells Fargo, compared to 2.4% for E*Trade -- a company that has struggled with its loan portfolio. It's clear the previously mentioned banks do a better job getting the most out of interest-earning assets.
So what does it all mean?
Banks don't move to the beat of just one drum, what might be right for one, may not be right for some. So judge not where the bank is loaning money, but rather how its portfolio diversification changes over time, and the return it's generating from its interest-bearing assets.
Ultimately, the bank that sticks to what it does best is the best at avoiding risk.
Stay tuned as we continue to dig into U.S. Bancorp on our journey to better understand banks.
