With the end of the year drawing to a close, many investors are reevaluating the stocks they hold -- and if BB&T (BBT +0.02%) is in your portfolio it may be time to cash out.

Photo source: BB&T
BB&T is lumped into a class of super-regional banks that aren't nearly as massive as the megabanks, but certainly still have a broad reach across the areas in which they operate. Headquartered in Winston-Salem, N.C., BB&T operates principally in North Carolina, South Carolina, Virginia, Georgia, and Florida, and more than 80% of its deposits are in those states.
It trails only Bank of America (BAC 0.57%) and Wells Fargo (WFC +0.41%) for market share, narrowly edging SunTrust (STI +0.00%) to hold on to third place in those five states:
|
Branches |
Deposits ($billions) |
Market Share | |
|---|---|---|---|
|
Bank of America |
1,288 |
$308.9 |
24% |
|
Wells Fargo |
1,716 |
$194.1 |
15.1% |
|
BB&T |
1,346 |
$110.7 |
8.6% |
|
SunTrust |
1,243 |
$105.6 |
8.2% |
Although BB&T has shown it can compete with the big banks and best the smaller ones when it comes to market presence, there are still three key reasons why you should consider selling this stock.
1. It's wasting money
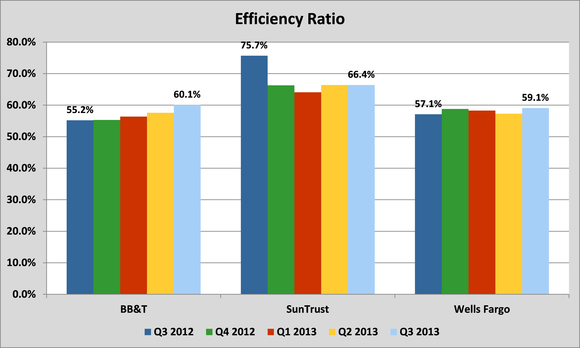
The efficiency ratio is a key measure to gauge how well the bank is spending its money. It's a measure of the cost required to generate each dollar of revenue. The lower that number the better. Yet over the last few quarters, BB&T has watched its ratio move higher while its competitors and regional bank peers have seen theirs move in the right direction.

Source: Company Earnings Reports
Year to date, BB&T's efficiency ratio is at 58%, compared to 54% last year. This is a troubling trend, especially when measured against its principal comparable competitors. Although Wells Fargo also watched its efficiency ratio rise in the third quarter, year to date the ratio has fallen from 58.5% to 58.2%.
While BB&T was once a market leader in operating efficiently, it has trended in the wrong direction of late.
It's not as profitable
BB&T also at one point did an admirable job operating profitably, with strong results in return on average assets and return on equity -- yet those metrics have also fallen by the wayside over the last nine months:
|
Return on Average Assets |
Return on Equity | |||
|---|---|---|---|---|
|
2012 |
2013 |
2012 |
2013 | |
|
Bank of America |
0.2% |
0.5% |
1.5% |
4.2% |
|
Wells Fargo |
1.4% |
1.5% |
12.8% |
13.9% |
|
BB&T |
1.1% |
0.8% |
10.3% |
7.1% |
|
SunTrust |
1.2% |
0.7% |
10.5% |
5.8% |
Source: Company Earnings Reports
It's important to note here that SunTrust's profitability fell due to nearly $400 million worth of litigation and one-time charges realized in the third quarter, which brought return on average assets to 0.44% and return on equity to 3.5%. Also, in the third quarter of 2012 the bank had a one-time gain of $1.9 billion as a result of its sale of a Coca-Cola investment. The point being that the metrics are a little tougher to compare to BB&T.
While BB&T did see a one-time tax adjustment in the third quarter, that does not explain the significant decline in profitability seen throughout 2013.
It's expensive
One of the key points of valuation for banks is their price to tangible book value, which measures the premium investors are willing to pay above what the bank is actually worth on its balance sheet. In the face of dwindling profitability and greater inefficiency, one would expect BB&T to have a lower value relative to its peers, but in fact just the opposite is true:
Knowing that investors are for some reason still willing to pay a premium for a company with declining results may be the last signal you need to cash out of this stock before it's too late.

