This Friday, First Niagara Financial Group (NASDAQ: FNFG), a $38 billion bank headquartered in Buffalo, New York, will report second-quarter earnings. Let's take a little time today to review the bank in preparation for the market's reaction to the earnings release on Friday.

When I evaluate banks, I follow a model made famous by former Wachovia CEO John Medlin: soundness, profitability, and growth. As investors, we then look at valuation and the potential for investment after gaining a better understanding for each bank.
Soundness
Soundness refers to the bank's asset quality. Generally speaking, this means loans. If a bank makes loans that are never repaid, that bank will fail, and fail quickly. The best banks put risk management first, ensuring that shareholder capital is protected if a portfolio of loans turns sour.
To measure this, we'll look at both non-performing assets and First Niagara Financial Group's provision for loan and lease losses. A simplified definition of non-performing assets is loans or other assets that have fallen seriously delinquent or are in foreclosure.
The provision for loan and lease losses is a reserve of money that the bank pulls out of its income each quarter to guard against future losses in the loan portfolio. Banks are required by regulation to maintain certain levels of reserves, but within that, management has plenty of wiggle room to over- or under-reserve. Over-reserving increases protection but hurts net income; under-reserving increases risk but keeps net income high.

First Niagara's non-performing loans and loan loss reserves. Source: BankRegData.com
For the quarter ending on March 31, First Niagara Financial had 0.52% non-performing assets as a percentage of total assets. The FDIC reports that banks with total assets greater than $10 billion on average had 1.5% non-performing assets as a percentage of total assets.
First Niagara Financial reserved $25 million for the first quarter, which represented 7.2% of operating revenue. That compares with 5% for the $10 billion-plus peer group, according to the FDIC.
Overall, the bank's loan portfolio is reasonably healthy and trending in the right direction. The bank appears to be adequately reserved for future losses. The past two quarters have seen a sharp increase in write downs to the problem loan portfolio, which indicates to me a more decisive and aggressive approach to dealing with these assets.
Profitability
After establishing an understanding of a bank's risk culture and soundness, next we can focus on profitability. Any investment in a business is an investment in that company's future earnings, so profitability is a particularly important consideration for any bank investor.
The first question, perhaps most obviously, is whether the bank generates a profit at all. According to data from the FDIC, 7.3% of U.S. banks failed to generate a profit at all in the first quarter. That's one in every 14 banks!
For First Niagara Financial, the first calendar quarter of 2014 wasn't that bad. The company generated total net revenues of $347 million for the quarter -- that's total interest income plus non-interest income minus interest expense.
Over the past 12 months, First Niagara Financial Group has generated $1.3 billion in total net revenue. Of that revenue, 78% was attributable to net interest income, the difference between interest earned on loans and paid out to depositors. The remaining 22% was through fees, trading, or other non-interest revenue sources.
The bank was able to turn a profit margin of 21% on that revenue.
For the first quarter, the company reported return on equity of 4.7%. Of the banks covered in this series of articles, the average return on equity was 8.9%. The FDIC reports that the average ROE for U.S. banks with total assets greater than $10 billion was 9.1%.

FNFG Profit Margin (Quarterly) data by YCharts. Return on equity here presented on a trailing-12-month basis.
Leverage
Leverage is a double-edged sword for banks and could easily fit into either the soundness or profitability categories. We'll call it a subset of both and discuss it here.
Leverage is just part of the game with banks, so if you're a conservative investor who really focuses on conservative capital structures, the banking industry may not be the best place for your money. Adding leverage is an easy way to juice return on equity, which is, generally speaking, a good thing. The bank increases assets and thus earnings, while maintaining a lower capital level.
The result is a higher numerator, a constant denominator, and a larger return-on-equity number. The math does the heavy lifting for you.
On the flip side, too much leverage can put the bank on thin ice if the loan portfolio takes a turn for the worse. A stronger equity base protects the bank from bankruptcy and bailouts, two outcomes that are both politically charged and downright terrible for shareholders.
Banks use all kinds of esoteric and overly complex accounting methods to determine leverage. We'll keep it simple here with an old-fashioned assets-to-equity ratio. The lower the number, the less levered (and more conservative) the bank.

FNFG Assets To Shareholder Equity (Quarterly) data by YCharts
First Niagara's assets to equity ratio comes in at 7.6. The average of the 62 banks analyzed in this series of articles was 9.1.
The bank's below-peer return on equity is correlated to the conservative leverage on the balance sheet. In this case, the trade-off facing both investors and bank management is leveraged risk versus return on equity. Management, at least as demonstrated by the financial metrics here, has chosen the more conservative option.
Growth and valuation
First Niagara saw its revenues change by 5.5% over the past 12 months. That compares with the 5.7% average of the 62 banks analyzed. This change in revenue corresponded with a steady increase in the bank's total assets.
Fifty-four percent of all U.S. banks saw year-over-year earnings growth in the first quarter.
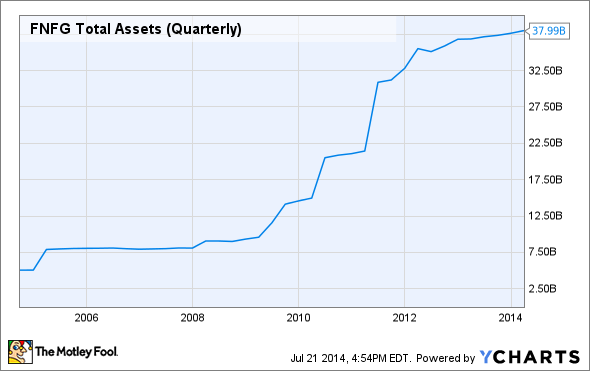
FNFG Total Assets (Quarterly) data by YCharts
Moving now to valuation, First Niagara traded at a forward price-to-earnings ratio of 12.3, according to data from S&P Capital IQ. That compares with the peer set average of 16.7.
First Niagara's market cap is, at the time of this writing, 1.4 times its tangible book value. The peer set average was 1.9.
Many investors use a general rule of thumb of buying a bank stock when the price-to-tangible book value is less than 0.5 and selling when it rises above 2. For me, that method is just way too oversimplified.
It sometimes makes sense to pay a premium for a bank stock that places a high value on credit culture and asset quality. These banks will survive and prosper while others fall by the wayside. That security can be worth a premium. Likewise, a bank that relies heavily on leverage to achieve above-average return on equity may not be worth the price, even if price-to-tangible book value is low. That risk may not justify even a healthy discount in price.

Based on the factors we've discussed here -- soundness, profitability, and growth -- First Niagara Financial appears to be undervalued. The bank has its fair share of problem loans on the books, but relative to peers and in terms of the trend, the bank is doing a good job managing these problems. The bank's return on equity is underwhelming; however, I see profitability rising handily in the coming years as interest rates rise to historically normal levels. At just 1.4 times tangible book value, this bank has plenty of room to run.