Investors use standard deviation as a proxy for volatility. To interpret standard deviation as it pertains to volatility, you must understand the assumptions of a normal bell curve. When data is normally distributed, 68% of the values fall within one standard deviation, and 95% of the values fall within two standard deviations.
When a stock has a standard deviation of 10%, the assumption is that its price fluctuations will remain within 10%, higher or lower, 68% of the time. Two standard deviations, or 20% higher or lower, should encompass 95% of price change scenarios. This interpretation is not ironclad, however. The drawbacks are discussed in the final section below.
How to calculate volatility with Microsoft Excel
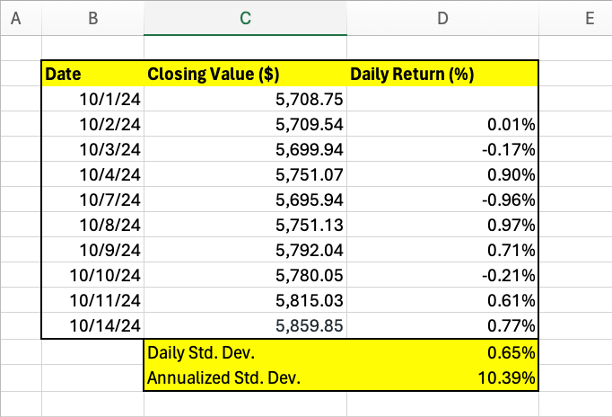
To demonstrate the process, we will use 10 days of closing values for the S&P 500 (SNPINDEX:^GSPC). In practice, you would need a much larger dataset to achieve statistical significance.
