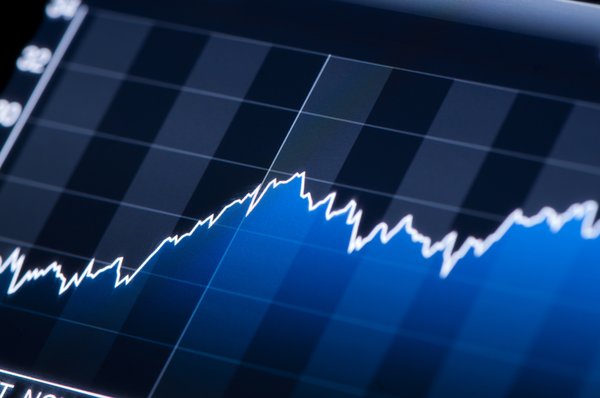
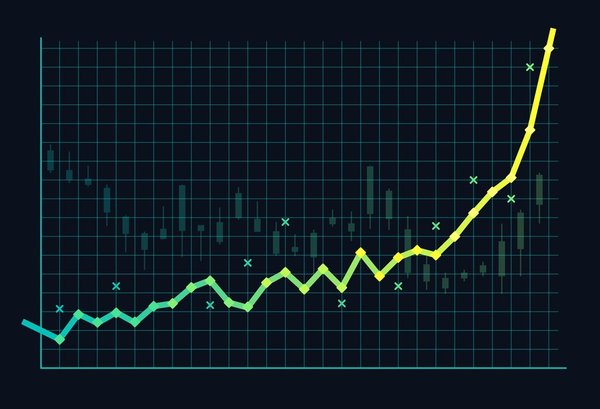
Market sentiment is the average sentiment toward a market or stock. If the stock or market is trending up and seems like it will continue, the sentiment is considered bullish. If it is trending down, the sentiment is considered bearish.
Market sentiment is a widely used concept among short-term traders. Let's take a look at how exactly it works and whether it's useful for long-term investors.

Understanding market sentiment
Understanding market sentiment
Over the short-term, stocks tend to keep going in the direction they're currently going. So if they're going up, they'll keep going up. Trading based on this knowledge is called trend following or momentum trading.
Of course, nothing trends in the same direction forever, so if you can gauge the sentiment of traders, you may be able to pinpoint when the trend will turn.
Long-term investors (which is what we are at The Motley Fool) make investment decisions that are independent from the market sentiment. It's possible that a high-flying growth stock with great bullish sentiment will be a good investment and a hated value stock with bearish sentiment also will be a good investment.
Remember, bullish sentiment means the stock (or market) is expected to go up in the near term, and bearish sentiment means the opposite.
Market sentiment also has a psychological tint. Bullish sentiment is often accompanied by greed and bearish sentiment by fear. Famous long-term investor Warren Buffett has said that it is better to be fearful when others are greedy and greedy when others are fearful. Buffett is a value investor, and value investors tend to be more contrarian by nature.
How to measure market sentiment
Here are a few of the technical indicators that are used to measure market sentiment.
VIX
VIX
The VIX, or CBOE Volatility Index, is a measure of expected volatility over the next 30 days. It is calculated based on the implied volatility baked into market option prices. The higher the VIX is, the higher the volatility is expected to be over the next month.
Here's the nitty-gritty of how it works in terms that a beginning investor can grasp. Option prices are made up of intrinsic value and implied volatility. Intrinsic value is the difference between the strike price of the option and the price of the underlying security. If you exercised the option right now, you would earn the intrinsic value. The option price is usually worth more than the intrinsic value because there is a chance that the underlying security's price will change before the term is up, which means the intrinsic value could go up. The bigger the difference between the option's price and intrinsic value, the more volatility traders expect over the term of the option. The VIX is the implied volatility number for options on the whole index.
The VIX is a good measure of market sentiment regarding volatility, but it doesn't really give you a good measure of which direction that volatility will go because it includes both calls (bullish) and puts (bearish) in its calculation.
CBOE Volatility Index (VIX)
High-low index
High-low index
The high-low index is a measure of how many stocks in the index are creating new 52-week highs versus how many are creating new 52-week lows. Thirty is considered to be a bearish indicator, and 70 is considered to be a bullish indicator.
Moving averages
Moving averages
Moving averages are used en masse by trend followers. The moving average is the average price of the stock or index over a set period. The most-used numbers are the 50-day and 200-day.
When the 50-day is above the 200-day, it is a bullish indicator and vice versa. Traders watch for crossovers. When the 50 crosses over the 200, it means sentiment has changed from bearish to bullish and vice versa.
Bullish percent index
Bullish percent index
Bullish percent index is calculated based on the chart patterns of stocks in the index. If 80% of the index has a bullish pattern, the sentiment for the market is considered bullish. If only 20% are bullish, the sentiment is bearish.
COT
COT
The COT, or Commitment of Traders report, is a widely used sentiment measure for commodity traders. It reports the futures holdings of various commodity traders. Many people use this report as a contrary indicator.
Example of market sentiment
Investor sentiment has had a heavy impact on the market in the recent past. The S&P 500 dropped from 3,380 on Feb. 14, 2020, to a low of 2,304.92 on March 20, 2020, which is when the COVID-19 pandemic really got going. Businesses were closing, there were shortages everywhere, and investors were taken over by fear. Since the sentiment was bearish, this led to an incredible drop in a little more than a month.
The key point here is that the market dropped before there was any real basis for the drop. It dropped because traders were fearful of what could happen to the economy.
Later, the S&P rebounded to reach its February high by mid-August and breached 3,700 by the end of the year. It did this despite small businesses declaring bankruptcy in droves and big companies across the U.S. reporting bad earnings numbers. It happened because market sentiment had turned bullish.
Use market sentiment wisely
Though we don't recommend the type of short-term trading that rides on market sentiment day in and day out, we do think you can use market sentiment wisely as an investor. If you choose to be a contrarian, make sure the sentiment has reached bearish status. If you buy growth stocks, use the sentiment to confirm that the market agrees your stock is high quality.


