Accessibility Menu
MP Materials logo

MP Materials

(NYSE) MP

Current Price$44.04
Market Cap$8.09BMarket cap calculated using publicly traded shares outstanding only. Does not include unlisted, private, or dual-class non-traded shares. Implied market cap may vary.
Since IPO (2020)+355%
5 Year+37%
1 Year-22%
1 Month-20%
MP Materials last closing stock price
MetricPriceDate
Last closeUSD 45.462026-07-16
MP Materials stock price return by period
PeriodPrice returnPrice at period startPeriod start date
1 week-12.09%USD 51.712026-07-09
1 month-20.32%USD 57.052026-06-16
3 month-25.46%USD 60.992026-04-17
Year to date-10.02%USD 50.522025-12-31
1 year-22.36%USD 58.552025-07-16
3 year+82.86%USD 24.862023-07-17
5 year+37.38%USD 33.092021-07-16
Since inception+354.6%USD 10.002020-06-22

MP Materials Financials at a Glance

Market Cap

$8.09BMarket cap calculated using publicly traded shares outstanding only. Does not include unlisted, private, or dual-class non-traded shares. Implied market cap may vary.

Revenue (TTM)

$347.57M

Net Income (TTM)

-$71.19M

EPS (TTM)

-$0.42

P/E Ratio

-107.07

Dividend

$0.00

Beta (Volatility)

1.63 (High)

Price

$44.04

Volume

126,407

Open

$44.42

Previous Close

$45.46

Daily Range

$43.81 - $45.47

52-Week Range

$43.81 - $100.25

Estimated Earnings Date

Aug 6, 2026

MP: Motley Fool Moneyball Superscore

67

Our CEO Is Handing Members His Secret Weapon

It's called Motley Fool Moneyball, our new proprietary AI tool

We spent over half a million dollars in R&D to build a tool that makes stock research faster, sharper, and smarter. Our analysts use it every day, and now, you can too.

Get Access Now

About MP Materials

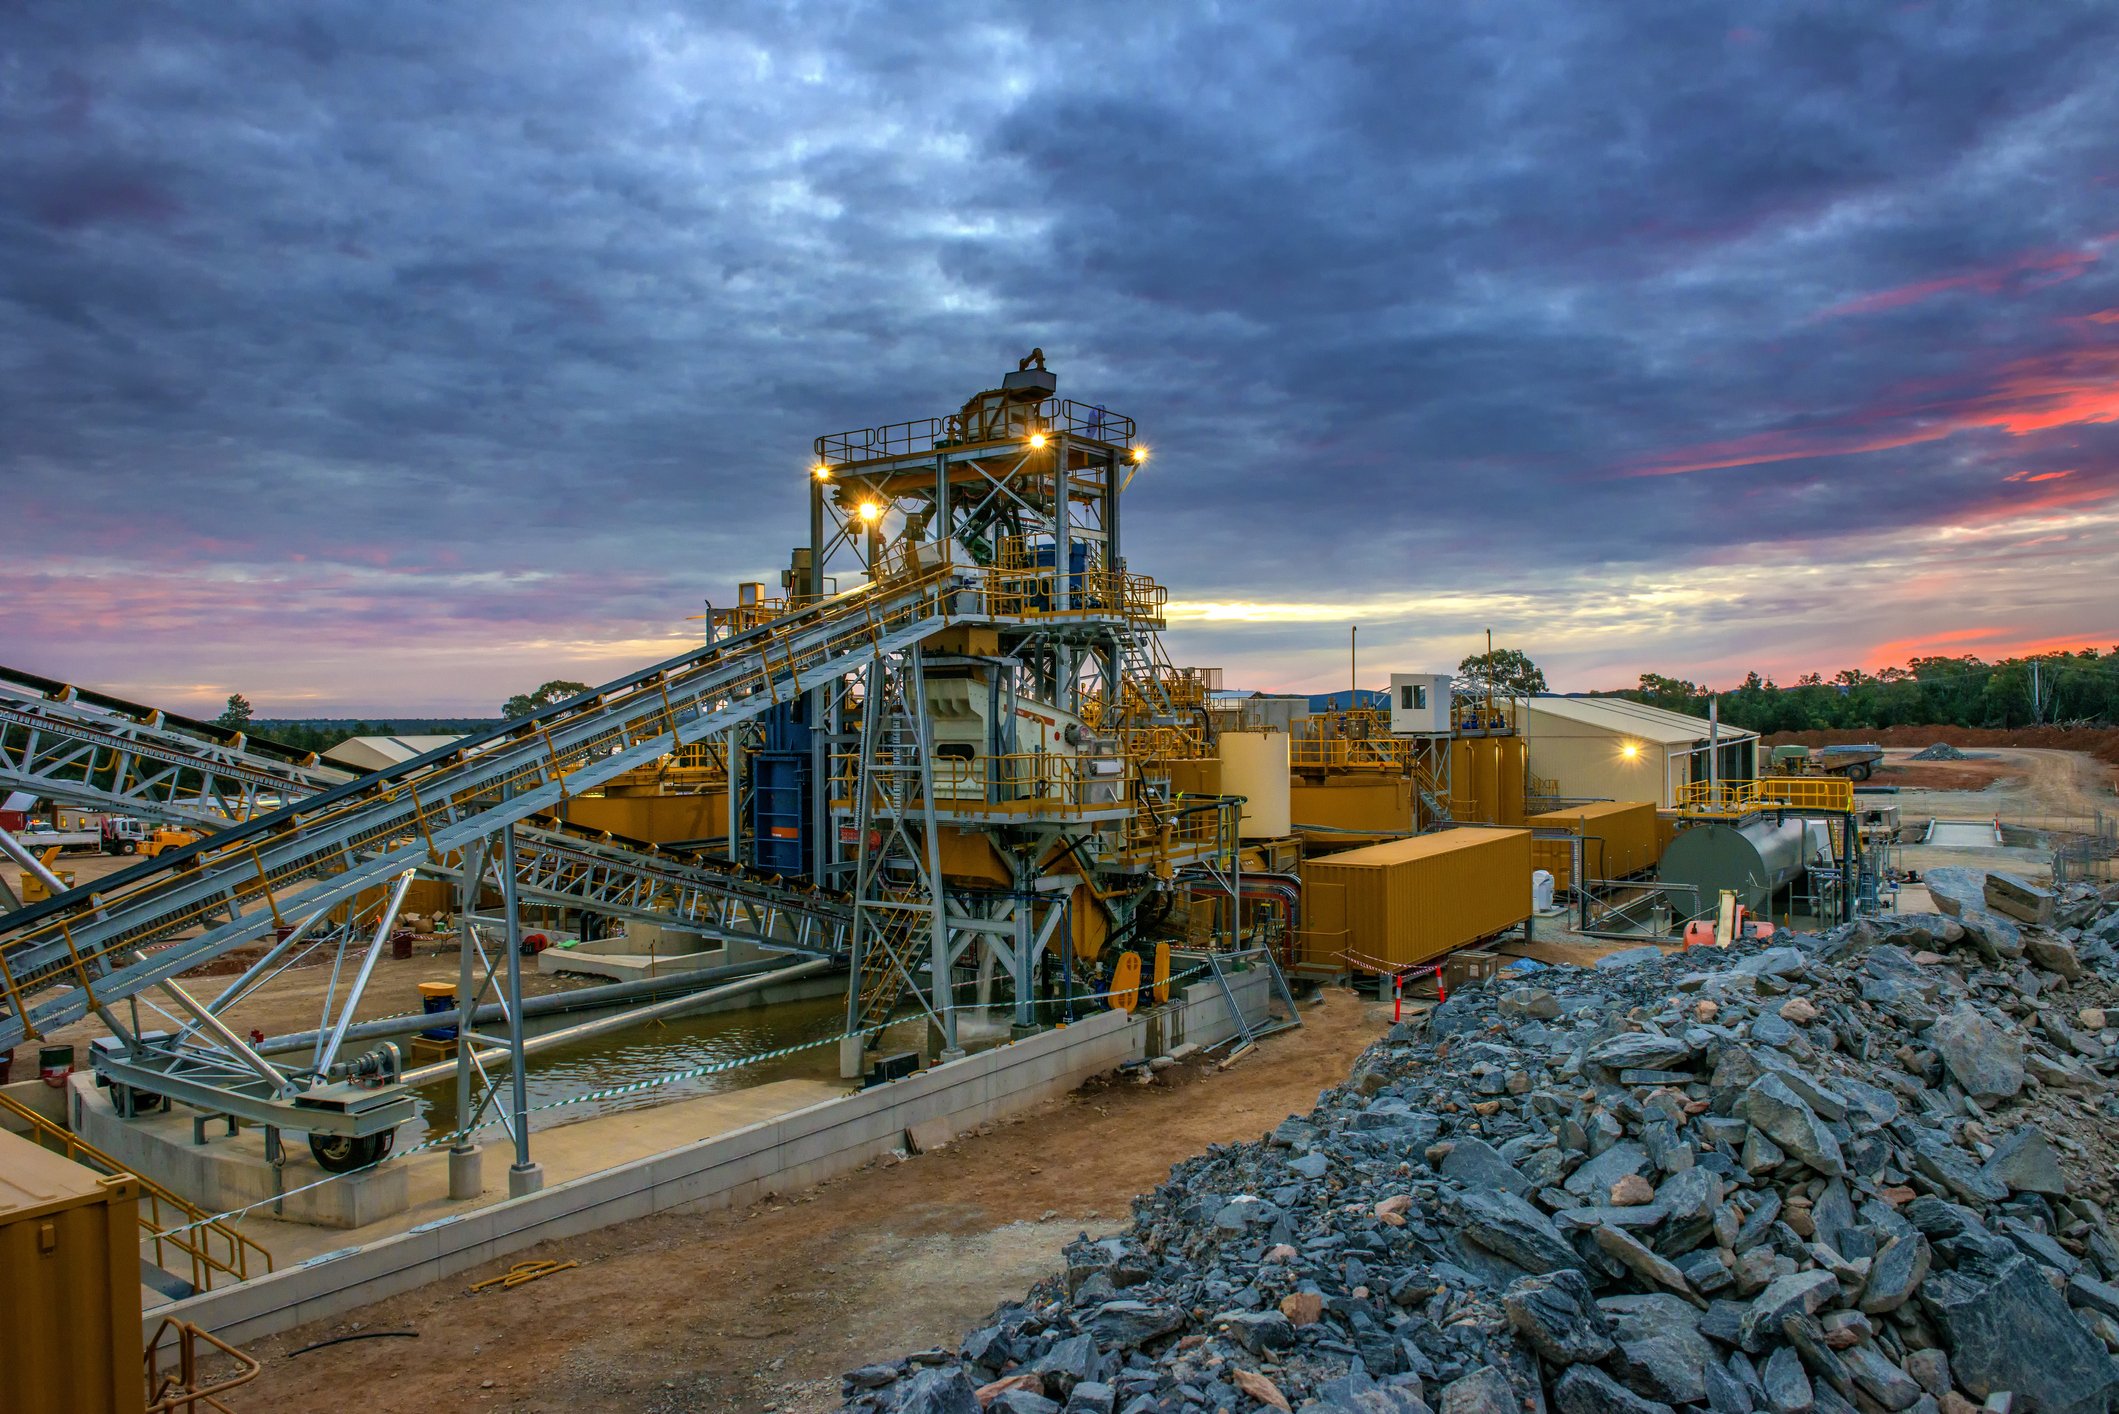
MP Materials mines and processes rare earth minerals in California. These materials help power electric vehicle motors and wind turbines. The company also makes magnets for high-tech electronics and defense systems.

What MP Materials Makes

  • Materials Segment: Upstream and midstream operations that produce rare earth oxides and concentrate; generates the majority of revenue from neodymium-praseodymium (NdPr) used in high-strength magnets.
  • Magnetics Segment: Downstream manufacturing of alloys and finished magnets; began generating revenue in early 2025 through sales to General Motors.
  • Separated Rare Earths: Refined products including cerium and lanthanum; these are used in catalysts for vehicle emissions and glass polishing.
  • Heavy Rare Earths: Concentrated minerals like terbium and dysprosium; these help magnets stay strong at high temperatures.

A National Supply Chain Pivot

  • Entered a public-private partnership with the U.S. Department of War in July 2025 to build a domestic magnet supply chain.
  • Signed a long-term agreement with Apple in July 2025 to supply magnets and develop recycling capabilities at the Mountain Pass site.
  • Partnered with General Motors in April 2022 to provide magnetic precursor products and finished magnets from the Texas facility.
  • Established a distribution deal with Sumitomo Corporation of Americas in February 2023 to serve the Japanese market through 2030.

Why This Mine Matters

MP Materials operates the only scaled rare earth mining and processing site in North America, reducing reliance on single-region supply chains. Its facility uses a dry-stack tailings process that recycles roughly 95% of the water used during milling and flotation.

The Recent Numbers

  • Revenue reached $104 million in Q4 2025, up 70% from $61 million in Q4 2024.
  • Net income hit $9.4 million in Q4 2025, up 142% from a $22 million loss in Q4 2024.
  • Gross profit rose to $34 million in Q4 2025, up 276% year-over-year.
  • Market capitalization grew to $9 billion in Q4 2025, a 252% increase from $2.5 billion in Q4 2024.
  • Free cash flow was negative $109 million in Q4 2025, reflecting heavy spending on new manufacturing facilities.

The Evolution of Mountain Pass

MP Materials has transformed from a raw ore miner into a vertically integrated manufacturer of refined metals and finished magnets. This shift creates a complete American supply chain for the critical materials used in modern green and defense technologies.

AI Generated • Apr 21, 2026

Industry

Metals and Mining

Sector

Materials

Employees

998

CEO

James Henry Litinsky, MBA

Headquarters

Las Vegas, NV 89119, US

MP Financials

Key Financial Metrics (TTM)

Gross Margin

24.16%

Operating Margin

-39.42%

Net Income Margin

-20.48%

Return on Equity

-3.49%

Return on Capital

-3.57%

Return on Assets

-1.85%

Earnings Yield

-0.93%

Dividend Yield

0.00%

Payout Ratio

0.00%

Stock Overview

Market Cap

$8.09BMarket cap calculated using publicly traded shares outstanding only. Does not include unlisted, private, or dual-class non-traded shares. Implied market cap may vary.

Shares Outstanding

178.02M

Volume

126.41K

Avg. Volume

6.01M

Financials (TTM)

Gross Profit

$83.98M

Operating Income

-$137.01M

EBITDA

$18.77M

Operating Cash Flow

-$94.47M

Capital Expenditure

-$219.28M

Free Cash Flow

-$313.75M

Cash & ST Invst.

$1.74B

Total Debt

$1.05B

MP Materials Performance Analysis

MP Materials annual revenue and year-over-year revenue growth by fiscal year
Fiscal yearPeriod endRevenueYoY growth
20222022-12-31USD 527,510,00058.9%
20232023-12-31USD 253,445,000-52.0%
20242024-12-31USD 203,855,000-19.6%
20252025-12-31USD 275,457,00035.1%
MP Materials sequential (quarter-over-quarter) revenue growth by fiscal quarter
Fiscal quarterPeriod endQoQ growth
Q22025-06-30-5.6%
Q32025-09-30-6.7%
Q42025-12-3193.6%
Q12026-03-3128.2%
MP Materials annual diluted earnings per share and year-over-year EPS growth by fiscal year
Fiscal yearPeriod endDiluted EPSYoY growth
20222022-12-31USD 1.52108.1%
20232023-12-31USD 0.14-91.0%
20242024-12-31USD -0.57N/A
20252025-12-31USD -0.50-11.7%
MP Materials sequential (quarter-over-quarter) diluted earnings per share growth by fiscal quarter
Fiscal quarterPeriod endQoQ growth
Q22025-06-30-35.7%
Q32025-09-30-26.3%
Q42025-12-31119.7%
Q12026-03-31-184.6%

Revenue Growth Rate

Annual and quarterly growth comparison

Earnings Per Share Growth Rate

Annual and quarterly EPS growth comparison

Quarterly Performance

Name
Q1 2026YOY CHG

Revenue

$132.92M

+118.6%

Gross Profit

$58.68M

+723.9%

Gross Margin

44.14%

N/A

Market Cap

$8.09BMarket cap calculated using publicly traded shares outstanding only. Does not include unlisted, private, or dual-class non-traded shares. Implied market cap may vary.

N/A

Market Cap/Employee

$8.11M

N/A

Employees

998

N/A

Net Income

-$7.97M

+64.8%

EBITDA

$17.24M

+845.3%

Quarterly Fundamentals

Name
Q1 2026YOY CHG

Total Cash

$1.74B

+129.1%

Total Debt

$1.05B

+14.4%

Accounts Receivable

$119.27M

+5.8%

Inventory

$169.19M

+27.1%

Long Term Debt

$971.74M

+14.5%

Short Term Debt

$76.21M

+13.2%

Return on Assets

-1.85%

N/A

Return on Invested Capital

-3.85%

N/A

Free Cash Flow

-$79.29M

+15.4%

Operating Cash Flow

-$1.91M

+97.0%

Other Investments to Explore

People Also Watch

Symbol / CompanyPricePrice Chg
MOSThe Mosaic Company
$22.32-0.95%
HMYHarmony Gold Mining Company Limited
$14.58-1.39%
CDECoeur Mining, Inc.
$14.28-3.45%
WLKWestlake Corporation
$78.34+1.63%

Trending Stocks

Symbol / CompanyPricePrice Chg
TQQQProShares Trust - ProShares UltraPro Qqq
$67.07-0.05%
MUUDirexion Shares ETF Trust - Direxion Daily Mu Bull 2x Shares
$27.44-0.00%
SQQQProShares Trust - ProShares UltraPro Short Qqq
$42.99+0.05%
TSLLDirexion Shares ETF Trust - Direxion Daily Tsla Bull 2x Shares
$11.36-0.05%

Questions About MP

What is the current price of MP Materials?

MP Materials is trading at $44.04 per share.

What is the 52-week range for MP Materials?

Over the past 52 weeks, MP Materials has traded between $43.81 and $100.25.

How much debt does MP Materials have?

As of the most recent reporting period, MP Materials reported total debt of $1.05B.

How much cash does MP Materials have on hand?

MP Materials reported $887.09M in cash and cash equivalents in its most recent financial results.

What is MP Materials’s dividend yield?

MP Materials does not currently have a dividend yield.

Premium Investing Services

Invest better with The Motley Fool. Get stock recommendations, portfolio guidance, and more from The Motley Fool's premium services.