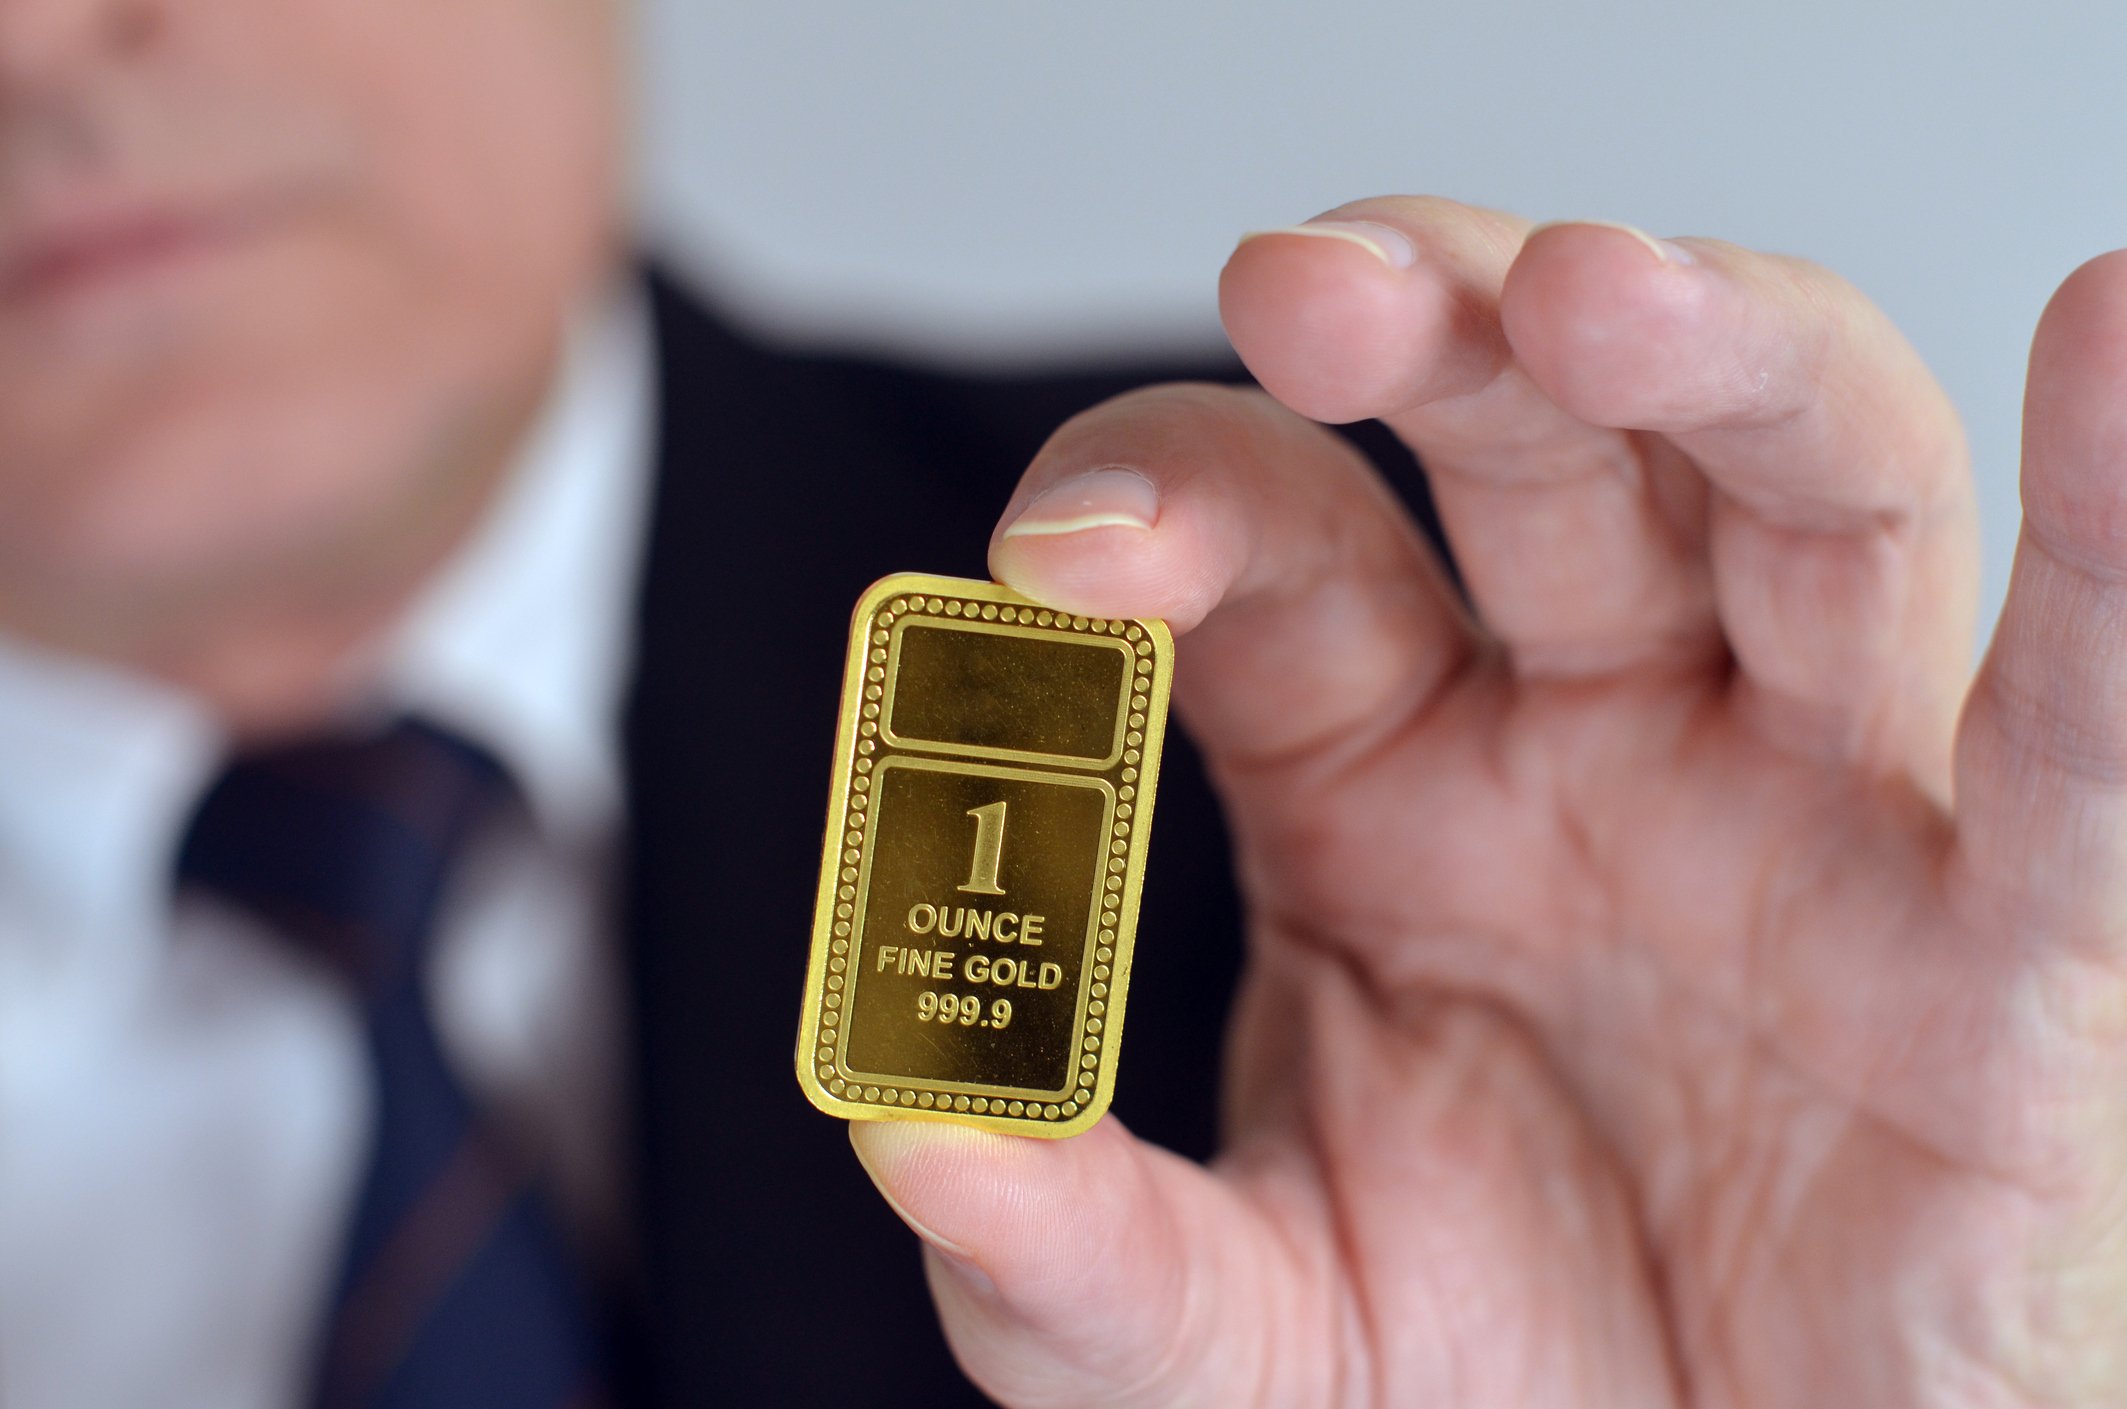
Harmony Gold Mining
(NYSE) HMY
Harmony Gold Mining Financials at a Glance
Market Cap
$9.70B
Revenue (TTM)
ZAR 150.28B
Net Income (TTM)
ZAR 26.34B
EPS (TTM)
$1.45
P/E Ratio
10.57
Dividend
$0.41
Beta (Volatility)
0.78 (Low)
Dividend
$0.41
Beta (Volatility)
0.78 (Low)
Price
$15.57
Volume
237,280
Open
$15.58
Price
$15.57
Volume
237,280
Open
$15.58
Previous Close
$15.57
Daily Range
$15.45 - $15.87
52-Week Range
$12.58 - $26.06
Estimated Earnings Date
Aug 27, 2026
Dividend
$0.41
Beta (Volatility)
0.78 (Low)
Price
$15.57
Volume
237,280
Open
$15.58
Previous Close
$15.57
Daily Range
$15.45 - $15.87
52-Week Range
$12.58 - $26.06
Estimated Earnings Date
Aug 27, 2026
HMY News


HMY: Motley Fool Moneyball Superscore
Our CEO Is Handing Members His Secret Weapon
It's called Motley Fool Moneyball, our new proprietary AI tool
We spent over half a million dollars in R&D to build a tool that makes stock research faster, sharper, and smarter. Our analysts use it every day, and now, you can too.
Get Access NowAbout Harmony Gold Mining
Industry
Metals and Mining
Sector
MaterialsEmployees
34,350
CEO
Beyers Nel, MBA
Website
www.harmony.co.zaHeadquarters
Randfontein, GP 1759, ZA
HMY Financials
Key Financial Metrics (TTM)
Gross Margin
42.35%
Operating Margin
35.82%
Net Income Margin
19.01%
Return on Equity
32.51%
Return on Capital
40.34%
Return on Assets
14.20%
Earnings Yield
9.46%
Dividend Yield
2.62%
Payout Ratio
15.29%
Stock Overview
Market Cap
$9.70B
Shares Outstanding
624.84M
Volume
237.28K
Avg. Volume
4.88M
Financials (TTM)
Gross Profit
ZAR 57.55B
Operating Income
ZAR 46.47B
EBITDA
ZAR 55.56B
Operating Cash Flow
ZAR 44.50B
Capital Expenditure
-ZAR 24.12B
Free Cash Flow
ZAR 20.38B
Cash & ST Invst.
ZAR 7.67B
Total Debt
ZAR 12.88B
Harmony Gold Mining Performance Analysis
Revenue Growth Rate
Annual and quarterly growth comparisonEarnings Per Share Growth Rate
Annual and quarterly EPS growth comparisonQuarterly Performance
Revenue
ZAR 46.57B
+47.5%
Gross Profit
ZAR 20.53B
+141.0%
Gross Margin
44.08%
N/A
Market Cap
$9.70B
N/A
Market Cap/Employee
$282.49K
N/A
Employees
34,350
N/A
Net Income
ZAR 9.29B
+56.9%
EBITDA
ZAR 22.52B
+131.0%
Quarterly Fundamentals
Total Cash
ZAR 7.67B
+106.4%
Total Debt
ZAR 12.88B
+283.1%
Accounts Receivable
ZAR 3.76B
+14.3%
Inventory
ZAR 4.85B
+51.0%
Long Term Debt
ZAR 1.63B
-51.3%
Short Term Debt
ZAR 11.25B
+80256.8%
Return on Assets
14.20%
N/A
Return on Invested Capital
36.28%
N/A
Free Cash Flow
ZAR 5.46B
+74.6%
Operating Cash Flow
ZAR 13.19B
+88.6%