Accessibility Menu
MYR Group logo

MYR Group(NASDAQ) MYRG

Current Price$378.08
Market Cap$5.90BMarket cap calculated using publicly traded shares outstanding only. Does not include unlisted, private, or dual-class non-traded shares. Implied market cap may vary.
Since IPO (2008)+2,233%
5 Year+293%
1 Year+94%
1 Month-19%
MYR Group last closing stock price
MetricPriceDate
Last closeUSD 379.172026-07-24
MYR Group stock price return by period
PeriodPrice returnPrice at period startPeriod start date
1 week-3.15%USD 391.512026-07-17
1 month-19.34%USD 470.082026-06-24
3 month+11.76%USD 339.282026-04-24
Year to date+73.53%USD 218.502025-12-31
1 year+94.11%USD 195.342025-07-24
3 year+152.95%USD 149.902023-07-25
5 year+293.37%USD 96.392021-07-23
Since inception+2,233.35%USD 16.252008-08-12

MYR Group Financials at a Glance

Market Cap

$5.90BMarket cap calculated using publicly traded shares outstanding only. Does not include unlisted, private, or dual-class non-traded shares. Implied market cap may vary.

Revenue (TTM)

$3.82B

Net Income (TTM)

$141.91M

EPS (TTM)

$9.07

P/E Ratio

41.79

Dividend

$0.00

Beta (Volatility)

1.19 (Average)

Price

$378.08

Volume

10,959

Open

$405.31

Previous Close

$378.08

Daily Range

$377.79 - $409.17

52-Week Range

$171.51 - $503.57

Estimated Earnings Date

Jul 29, 2026

MYRG: Motley Fool Moneyball Superscore

69

Our CEO Is Handing Members His Secret Weapon

It's called Motley Fool Moneyball, our new proprietary AI tool

We spent over half a million dollars in R&D to build a tool that makes stock research faster, sharper, and smarter. Our analysts use it every day, and now, you can too.

Get Access Now

About MYR Group

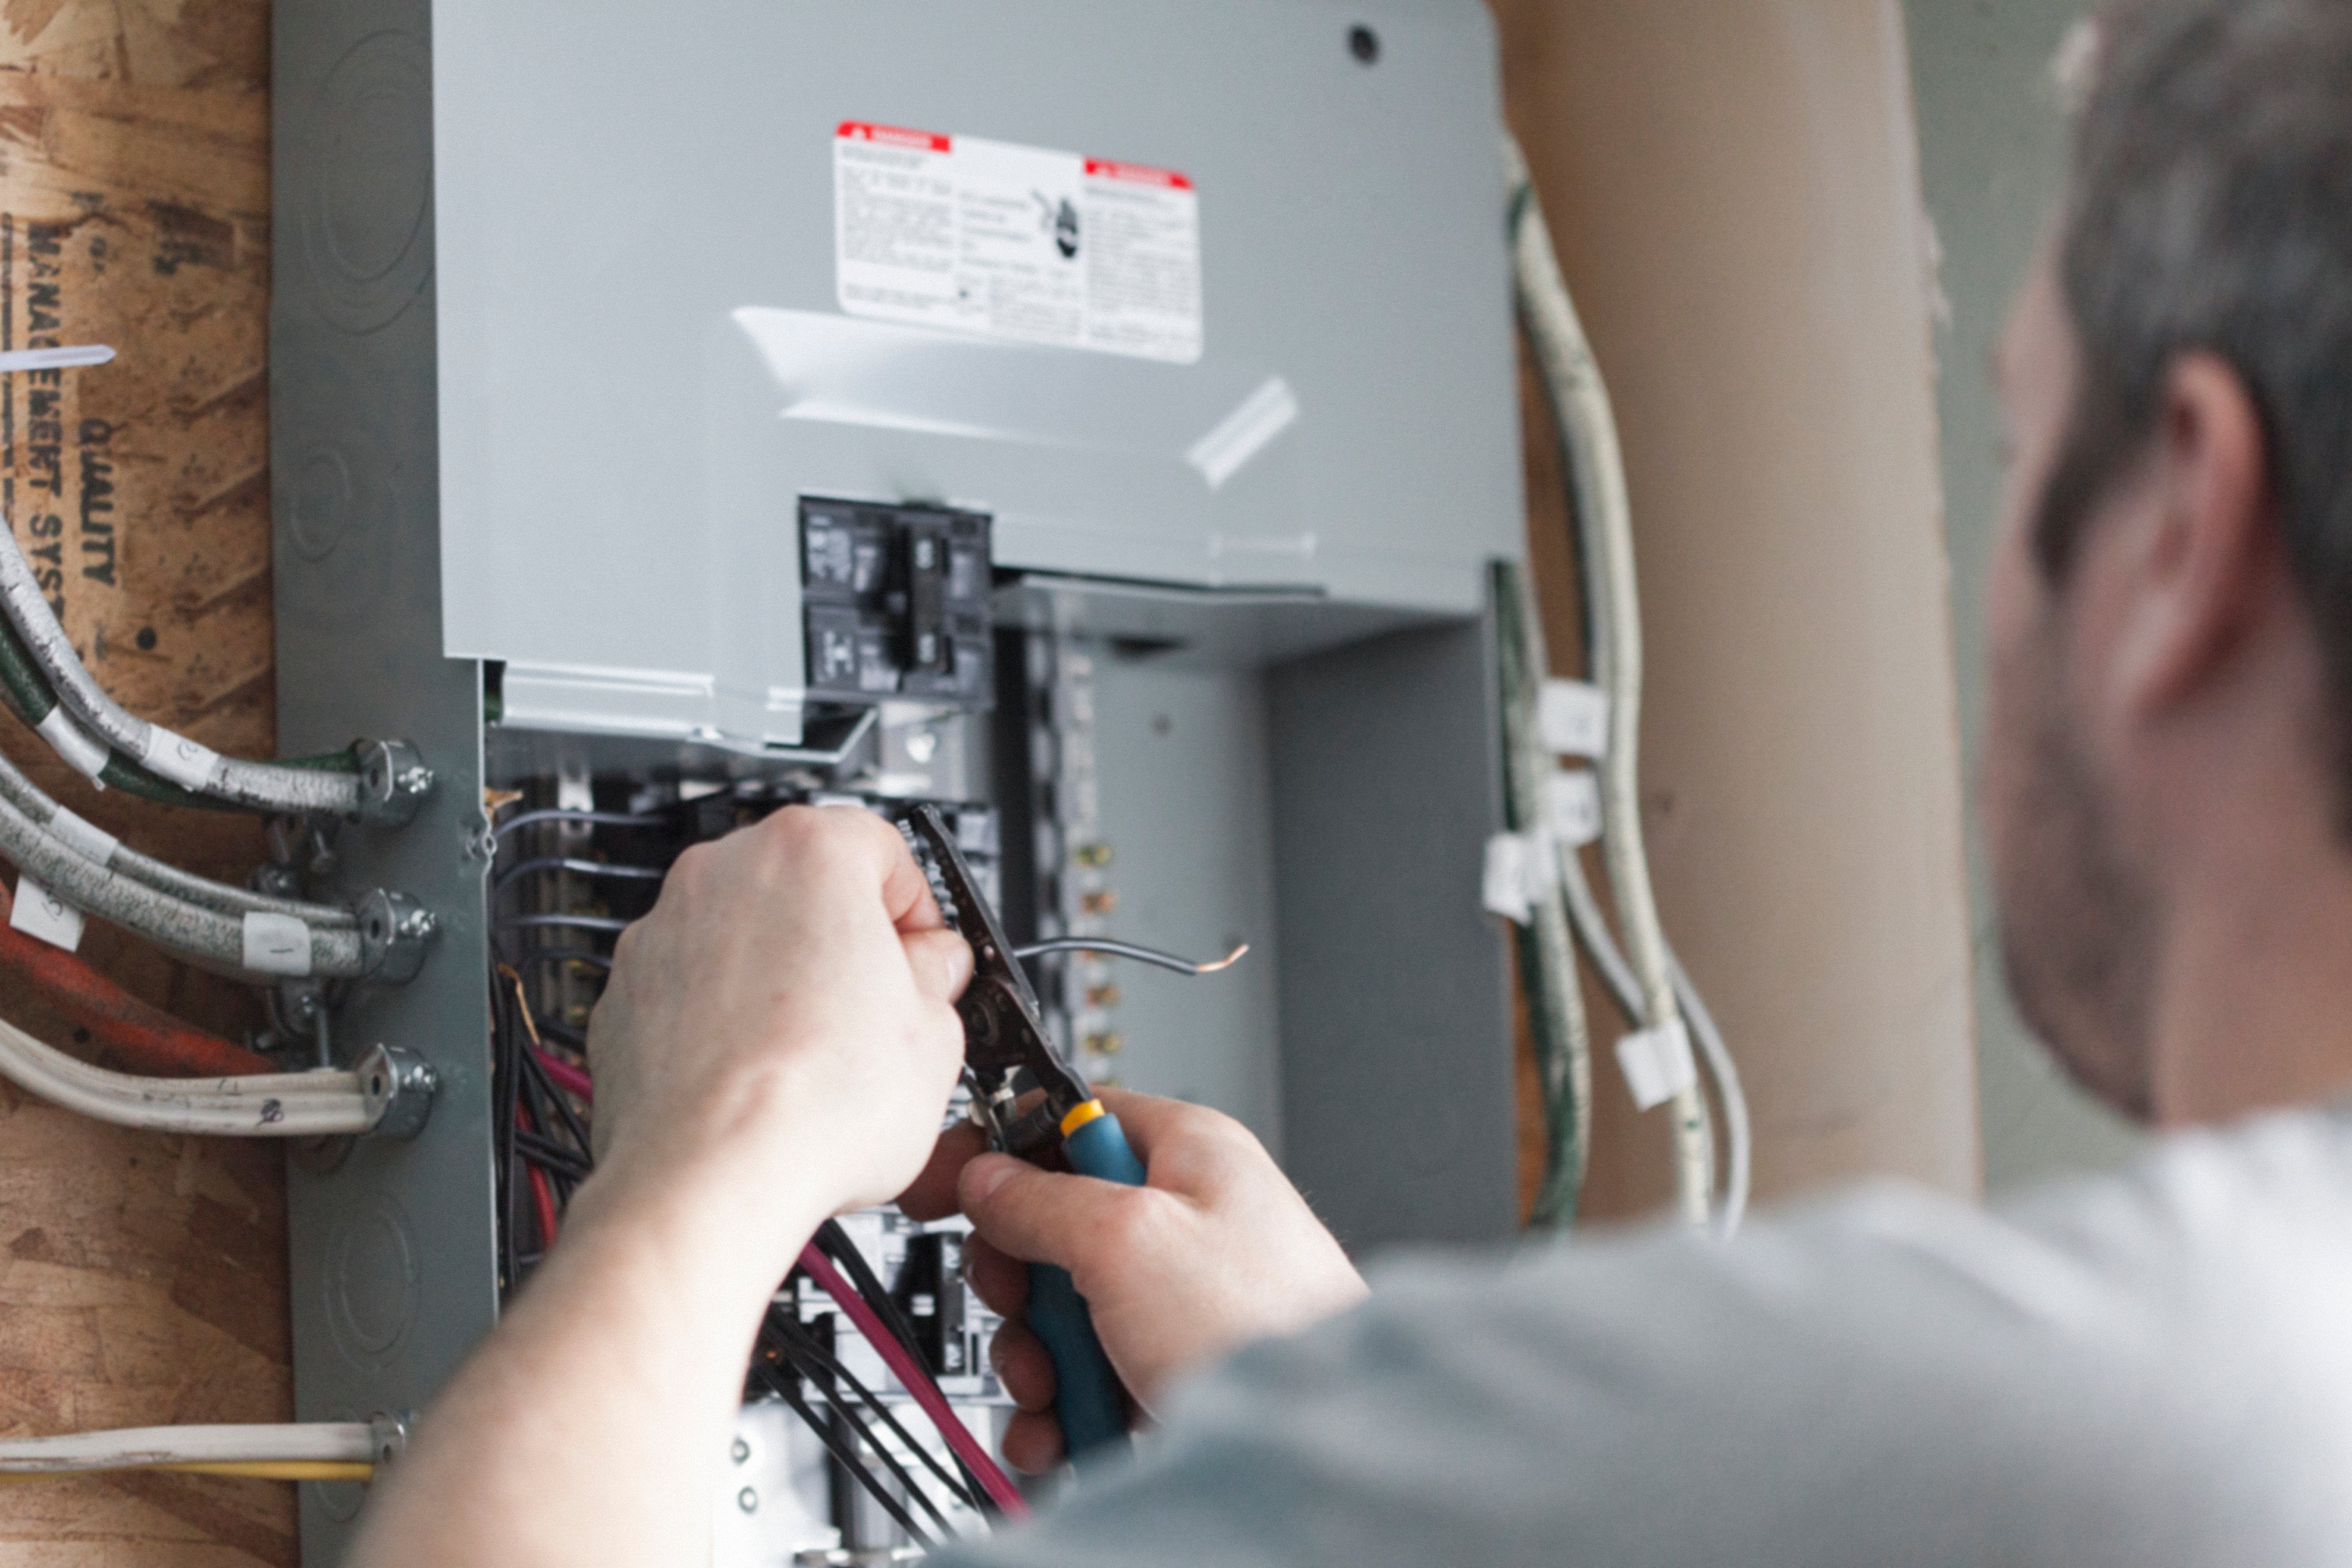
MYR Group helps keep the lights on by building and fixing the power lines that bring electricity to homes. They also install complex wiring and lighting systems for big buildings like hospitals, data centers, and airports. The company serves large utility providers and construction firms across the United States and Canada.

What They Build and Maintain

  • Transmission and Distribution: Design, construction, and repair of high-voltage power lines and substations for electric utilities; accounted for 54.7% of total revenue for the year ended December 31, 2025.
  • Commercial and Industrial: Electrical wiring and installation of traffic signals and lighting for large facilities like data centers and stadiums; accounted for 45.3% of total revenue for the year ended December 31, 2025.
  • Clean Energy and Infrastructure: Construction of renewable power facilities, electric vehicle charging stations, and specialized roadway lighting for government agencies and private developers.
  • Emergency Restoration: Rapid response teams that repair damaged electrical systems following hurricanes, ice storms, and other natural disasters.

Strategic Moves and Growth

  • Expanded the Canadian market presence through the operations of Powerline Plus Ltd. and PLP Redimix Ltd.
  • Grew the Commercial and Industrial segment through CSI Electrical Contractors, Inc. to serve technically complex projects in the western United States.
  • Increased focus on high-voltage transmission projects using the High Country Line Construction, Inc. trade name.

A Specialized National Fleet

MYR Group maintains a large, mobile fleet of specialized tools and heavy equipment like wire pullers and bucket trucks. This centralized equipment management allows the company to shift resources quickly between regions to respond to major weather events or large project demands.

The Recent Financial Record

  • Net income rose to $36.5 million in Q4 2025, up 128.8% from the previous year.
  • Revenue reached $973.5 million for Q4 2025, representing a 17.3% increase year-over-year.
  • Free cash flow grew to $84.9 million in Q4 2025, up 863.4% compared to Q4 2024.
  • Operating income hit $46.3 million in Q4 2025, a 53.5% increase from the same period in the prior year.

Bottom Line

MYR Group has transitioned from a long-standing local contractor into a major North American specialist in power and commercial infrastructure. The company has maintained growth by diversifying its services to include renewable energy and advanced data center installations.

AI Generated • Apr 23, 2026

Industry

Construction and Engineering

Employees

9,000

CEO

Richard S. Swartz, Jr.

Headquarters

Thornton, CO 80640, US

MYRG Financials

Key Financial Metrics (TTM)

Gross Margin

11.94%

Operating Margin

5.05%

Net Income Margin

3.71%

Return on Equity

22.14%

Return on Capital

21.29%

Return on Assets

8.48%

Earnings Yield

2.39%

Dividend Yield

0.00%

Payout Ratio

0.00%

Stock Overview

Market Cap

$5.90BMarket cap calculated using publicly traded shares outstanding only. Does not include unlisted, private, or dual-class non-traded shares. Implied market cap may vary.

Shares Outstanding

15.57M

Volume

10.96K

Avg. Volume

302.04K

Financials (TTM)

Gross Profit

$456.48M

Operating Income

$193.22M

EBITDA

$265.52M

Operating Cash Flow

$328.03M

Capital Expenditure

-$97.44M

Free Cash Flow

$230.59M

Cash & ST Invst.

$163.19M

Total Debt

$61.52M

MYR Group Performance Analysis

MYR Group annual revenue and year-over-year revenue growth by fiscal year
Fiscal yearPeriod endRevenueYoY growth
20222022-12-31USD 3,008,542,00020.4%
20232023-12-31USD 3,643,905,00021.1%
20242024-12-31USD 3,362,290,000-7.7%
20252025-12-31USD 3,657,889,0008.8%
MYR Group sequential (quarter-over-quarter) revenue growth by fiscal quarter
Fiscal quarterPeriod endQoQ growth
Q22025-06-308.0%
Q32025-09-305.6%
Q42025-12-312.4%
Q12026-03-312.8%
MYR Group annual diluted earnings per share and year-over-year EPS growth by fiscal year
Fiscal yearPeriod endDiluted EPSYoY growth
20222022-12-31USD 4.91-0.9%
20232023-12-31USD 5.4010.1%
20242024-12-31USD 1.83-66.1%
20252025-12-31USD 7.53311.1%
MYR Group sequential (quarter-over-quarter) diluted earnings per share growth by fiscal quarter
Fiscal quarterPeriod endQoQ growth
Q22025-06-3017.2%
Q32025-09-3020.6%
Q42025-12-3113.7%
Q12026-03-3128.3%

Revenue Growth Rate

Annual and quarterly growth comparison

Earnings Per Share Growth Rate

Annual and quarterly EPS growth comparison

Quarterly Performance

Name
Q1 2026YOY CHG

Revenue

$1.00B

+20.0%

Gross Profit

$133.22M

+39.2%

Gross Margin

13.32%

N/A

Market Cap

$5.90BMarket cap calculated using publicly traded shares outstanding only. Does not include unlisted, private, or dual-class non-traded shares. Implied market cap may vary.

N/A

Market Cap/Employee

$656.01K

N/A

Employees

9,000

N/A

Net Income

$46.80M

+100.8%

EBITDA

$82.45M

+63.7%

Quarterly Fundamentals

Name
Q1 2026YOY CHG

Total Cash

$163.19M

+1397.7%

Total Debt

$61.52M

-53.5%

Accounts Receivable

$871.02M

-5.6%

Inventory

$0.00

N/A

Long Term Debt

$43.32M

-62.2%

Short Term Debt

$18.20M

+3.5%

Return on Assets

8.48%

N/A

Return on Invested Capital

22.85%

N/A

Free Cash Flow

$68.62M

-2.3%

Operating Cash Flow

$84.75M

+1.8%

Other Investments to Explore

People Also Watch

Symbol / CompanyPricePrice Chg
VSECVSE Corporation
$195.42-0.98%
GVAGranite Construction Incorporated
$124.47-1.77%
ECGEverus Construction Group, Inc.
$129.99-5.78%
TPCTutor Perini Corporation
$86.77-1.02%

Trending Stocks

Symbol / CompanyPricePrice Chg
INTCIntel
$92.32-0.08%
NOKNokia
$9.10-0.06%
TSLLDirexion Shares ETF Trust - Direxion Daily Tsla Bull 2x Shares
$7.42-0.04%
ONDSOndas
$7.80-0.02%

Questions About MYRG

What is the current price of MYR Group?

MYR Group is trading at $378.08 per share.

What is the 52-week range for MYR Group?

Over the past 52 weeks, MYR Group has traded between $171.51 and $503.57.

How much debt does MYR Group have?

As of the most recent reporting period, MYR Group reported total debt of $61.52M.

How much cash does MYR Group have on hand?

MYR Group reported $163.19M in cash and cash equivalents in its most recent financial results.

What is MYR Group’s dividend yield?

MYR Group does not currently have a dividend yield.

Premium Investing Services

Invest better with The Motley Fool. Get stock recommendations, portfolio guidance, and more from The Motley Fool's premium services.