Accessibility Menu
Rivian Automotive logo

Rivian Automotive(NASDAQ) RIVN

Market Cap$21.40BMarket cap calculated using publicly traded shares outstanding only. Does not include unlisted, private, or dual-class non-traded shares. Implied market cap may vary.
Since IPO (2021)-85%
5 YearN/A
1 Year+19%
1 Month-15%
$15.73
+6.39%
+0.95Today
After hours$15.74+$0.01 (+0.06%)
Rivian Automotive last closing stock price
MetricPriceDate
Last closeUSD 14.782026-08-18
Rivian Automotive stock price return by period
PeriodPrice returnPrice at period startPeriod start date
1 week-9.66%USD 16.362026-08-11
1 month-15.33%USD 17.462026-07-17
3 month+7.65%USD 13.732026-05-20
Year to date-25.01%USD 19.712025-12-31
1 year+19.1%USD 12.412025-08-18
3 year-28.87%USD 20.782023-08-18
Since inception-85.33%USD 100.732021-11-10

Rivian Automotive Financials at a Glance

Market Cap

$21.40BMarket cap calculated using publicly traded shares outstanding only. Does not include unlisted, private, or dual-class non-traded shares. Implied market cap may vary.

Revenue (TTM)

$5.88B

Net Income (TTM)

-$3.23B

EPS (TTM)

-$2.58

P/E Ratio

-5.73

Dividend

$0.00

Beta (Volatility)

0.00 (Low)

Price

$15.73

Volume

17,853,321.524

Open

$15.02

Previous Close

$14.78

Daily Range

$14.92 - $15.74

52-Week Range

$11.84 - $22.69

Estimated Earnings Date

Nov 3, 2026

RIVN: Motley Fool Moneyball Superscore

59

Our CEO Is Handing Members His Secret Weapon

It's called Motley Fool Moneyball, our new proprietary AI tool

We spent over half a million dollars in R&D to build a tool that makes stock research faster, sharper, and smarter. Our analysts use it every day, and now, you can too.

Get Access Now

About Rivian Automotive

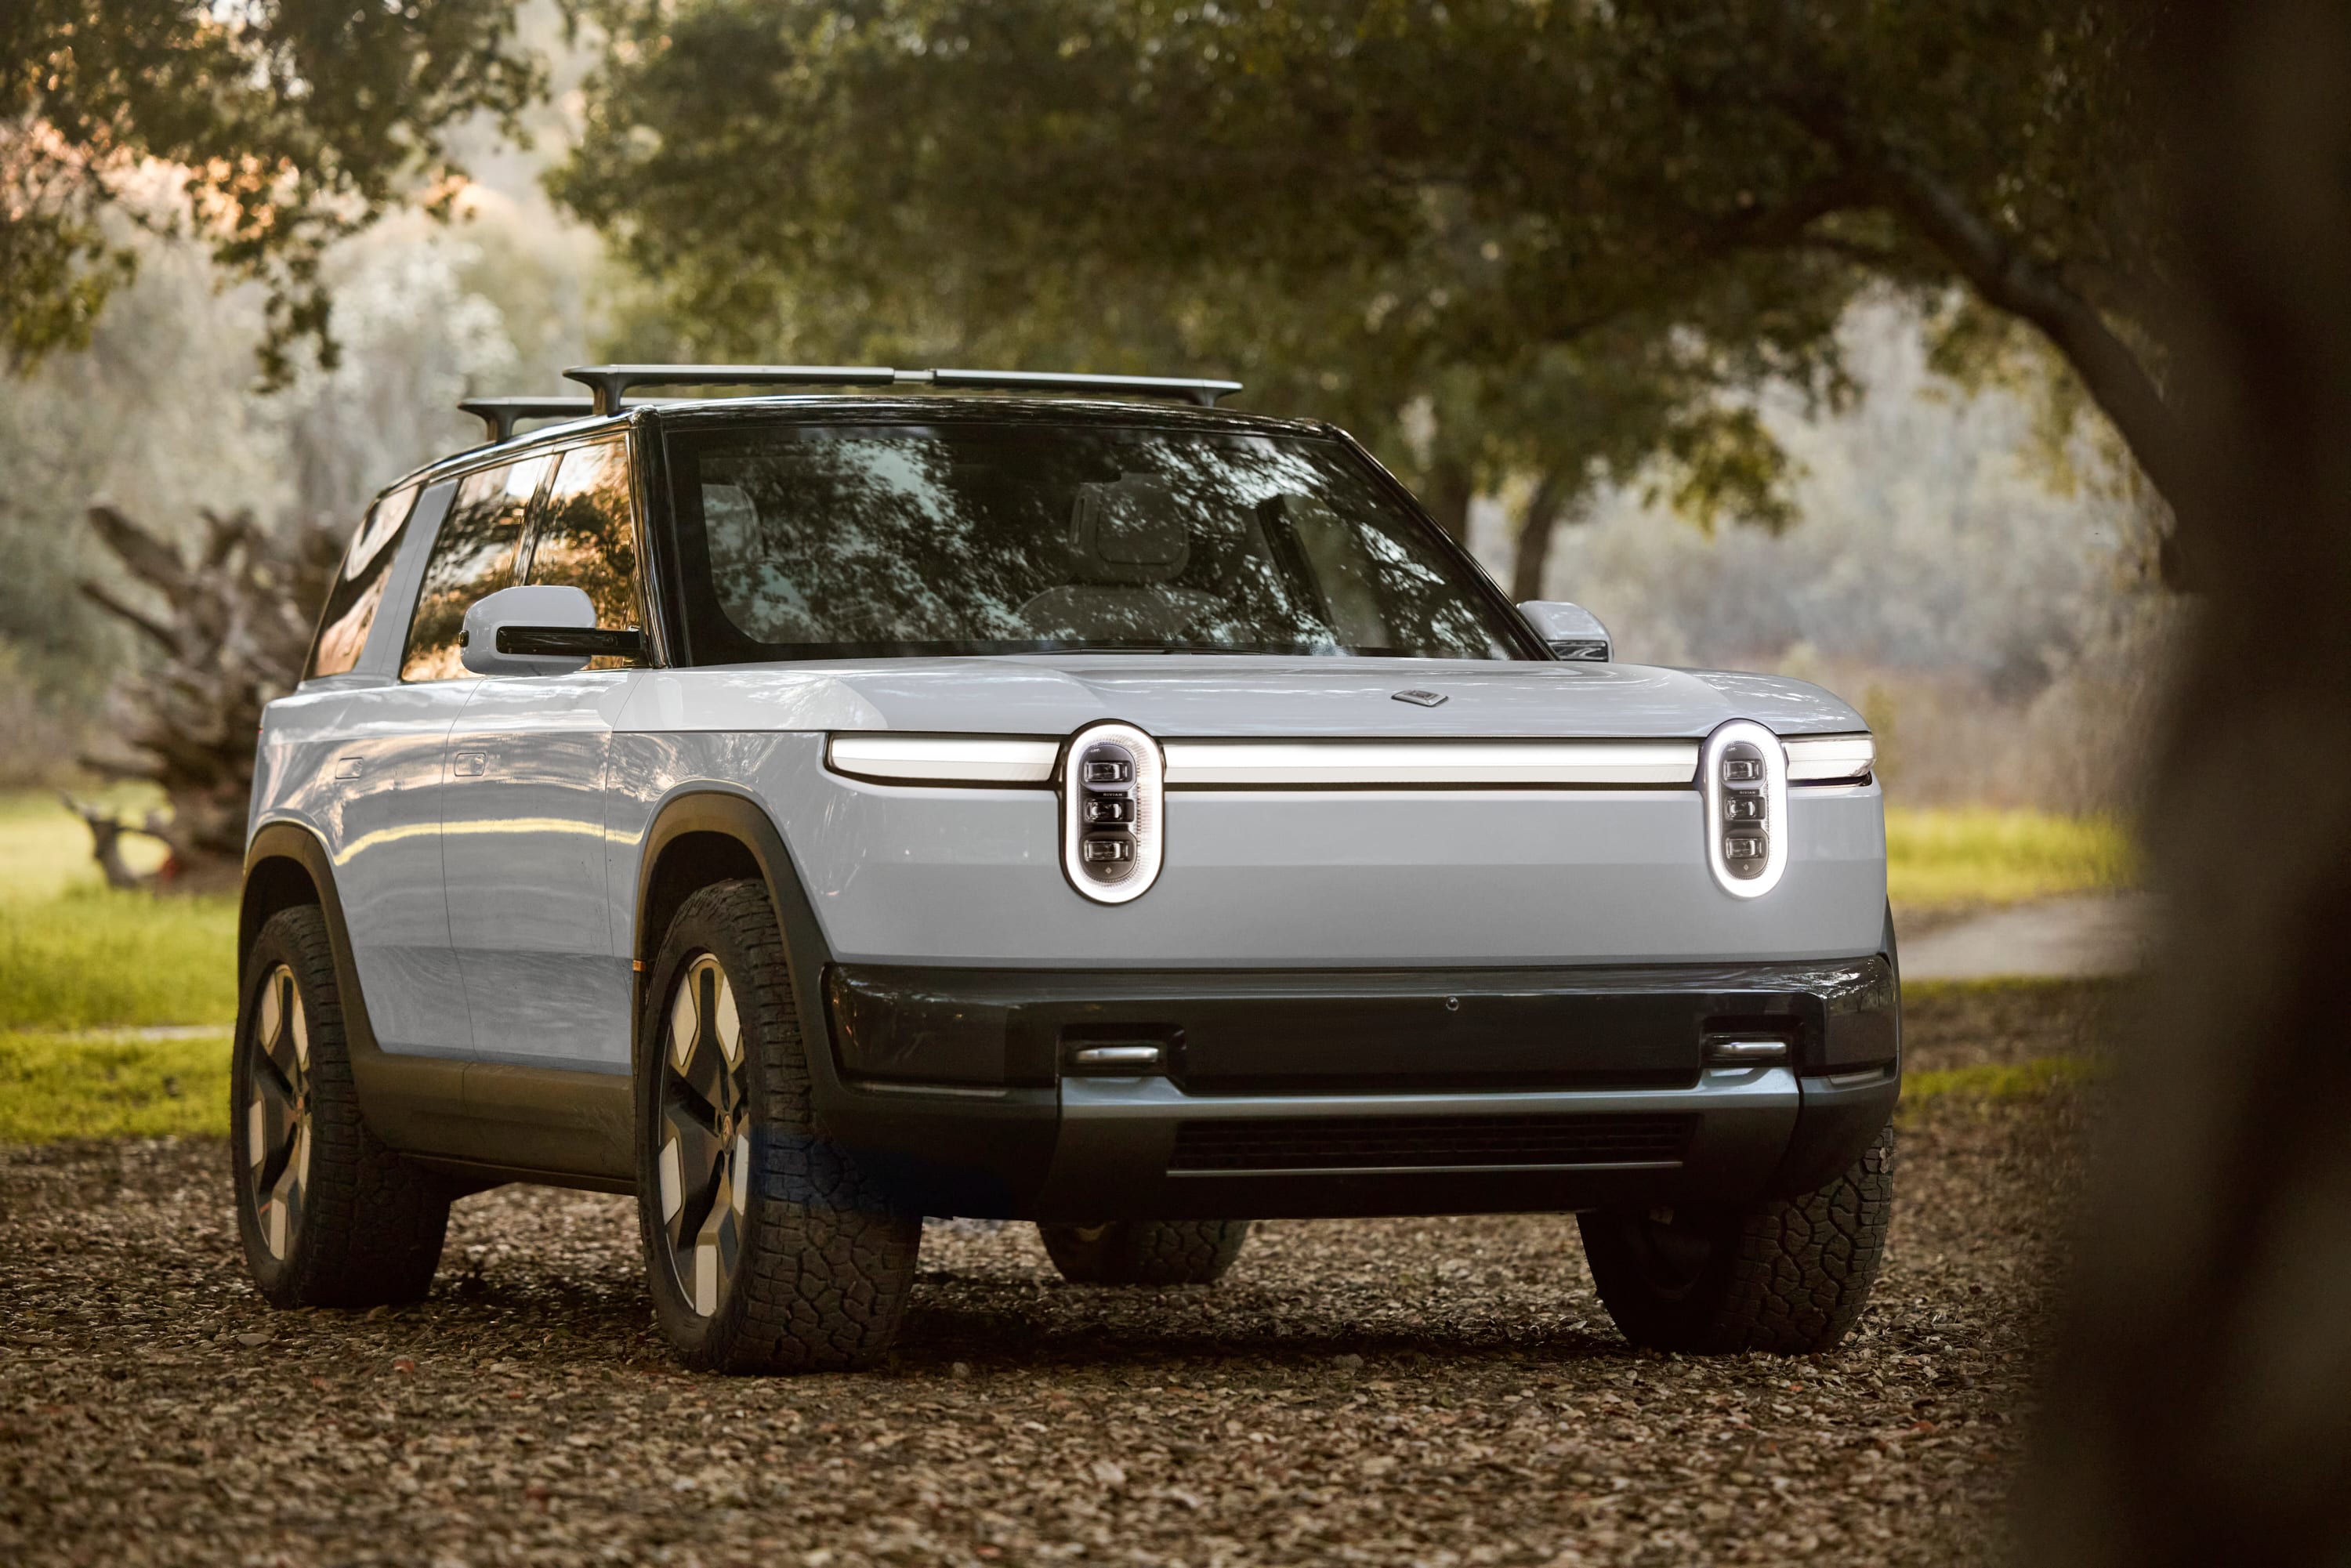
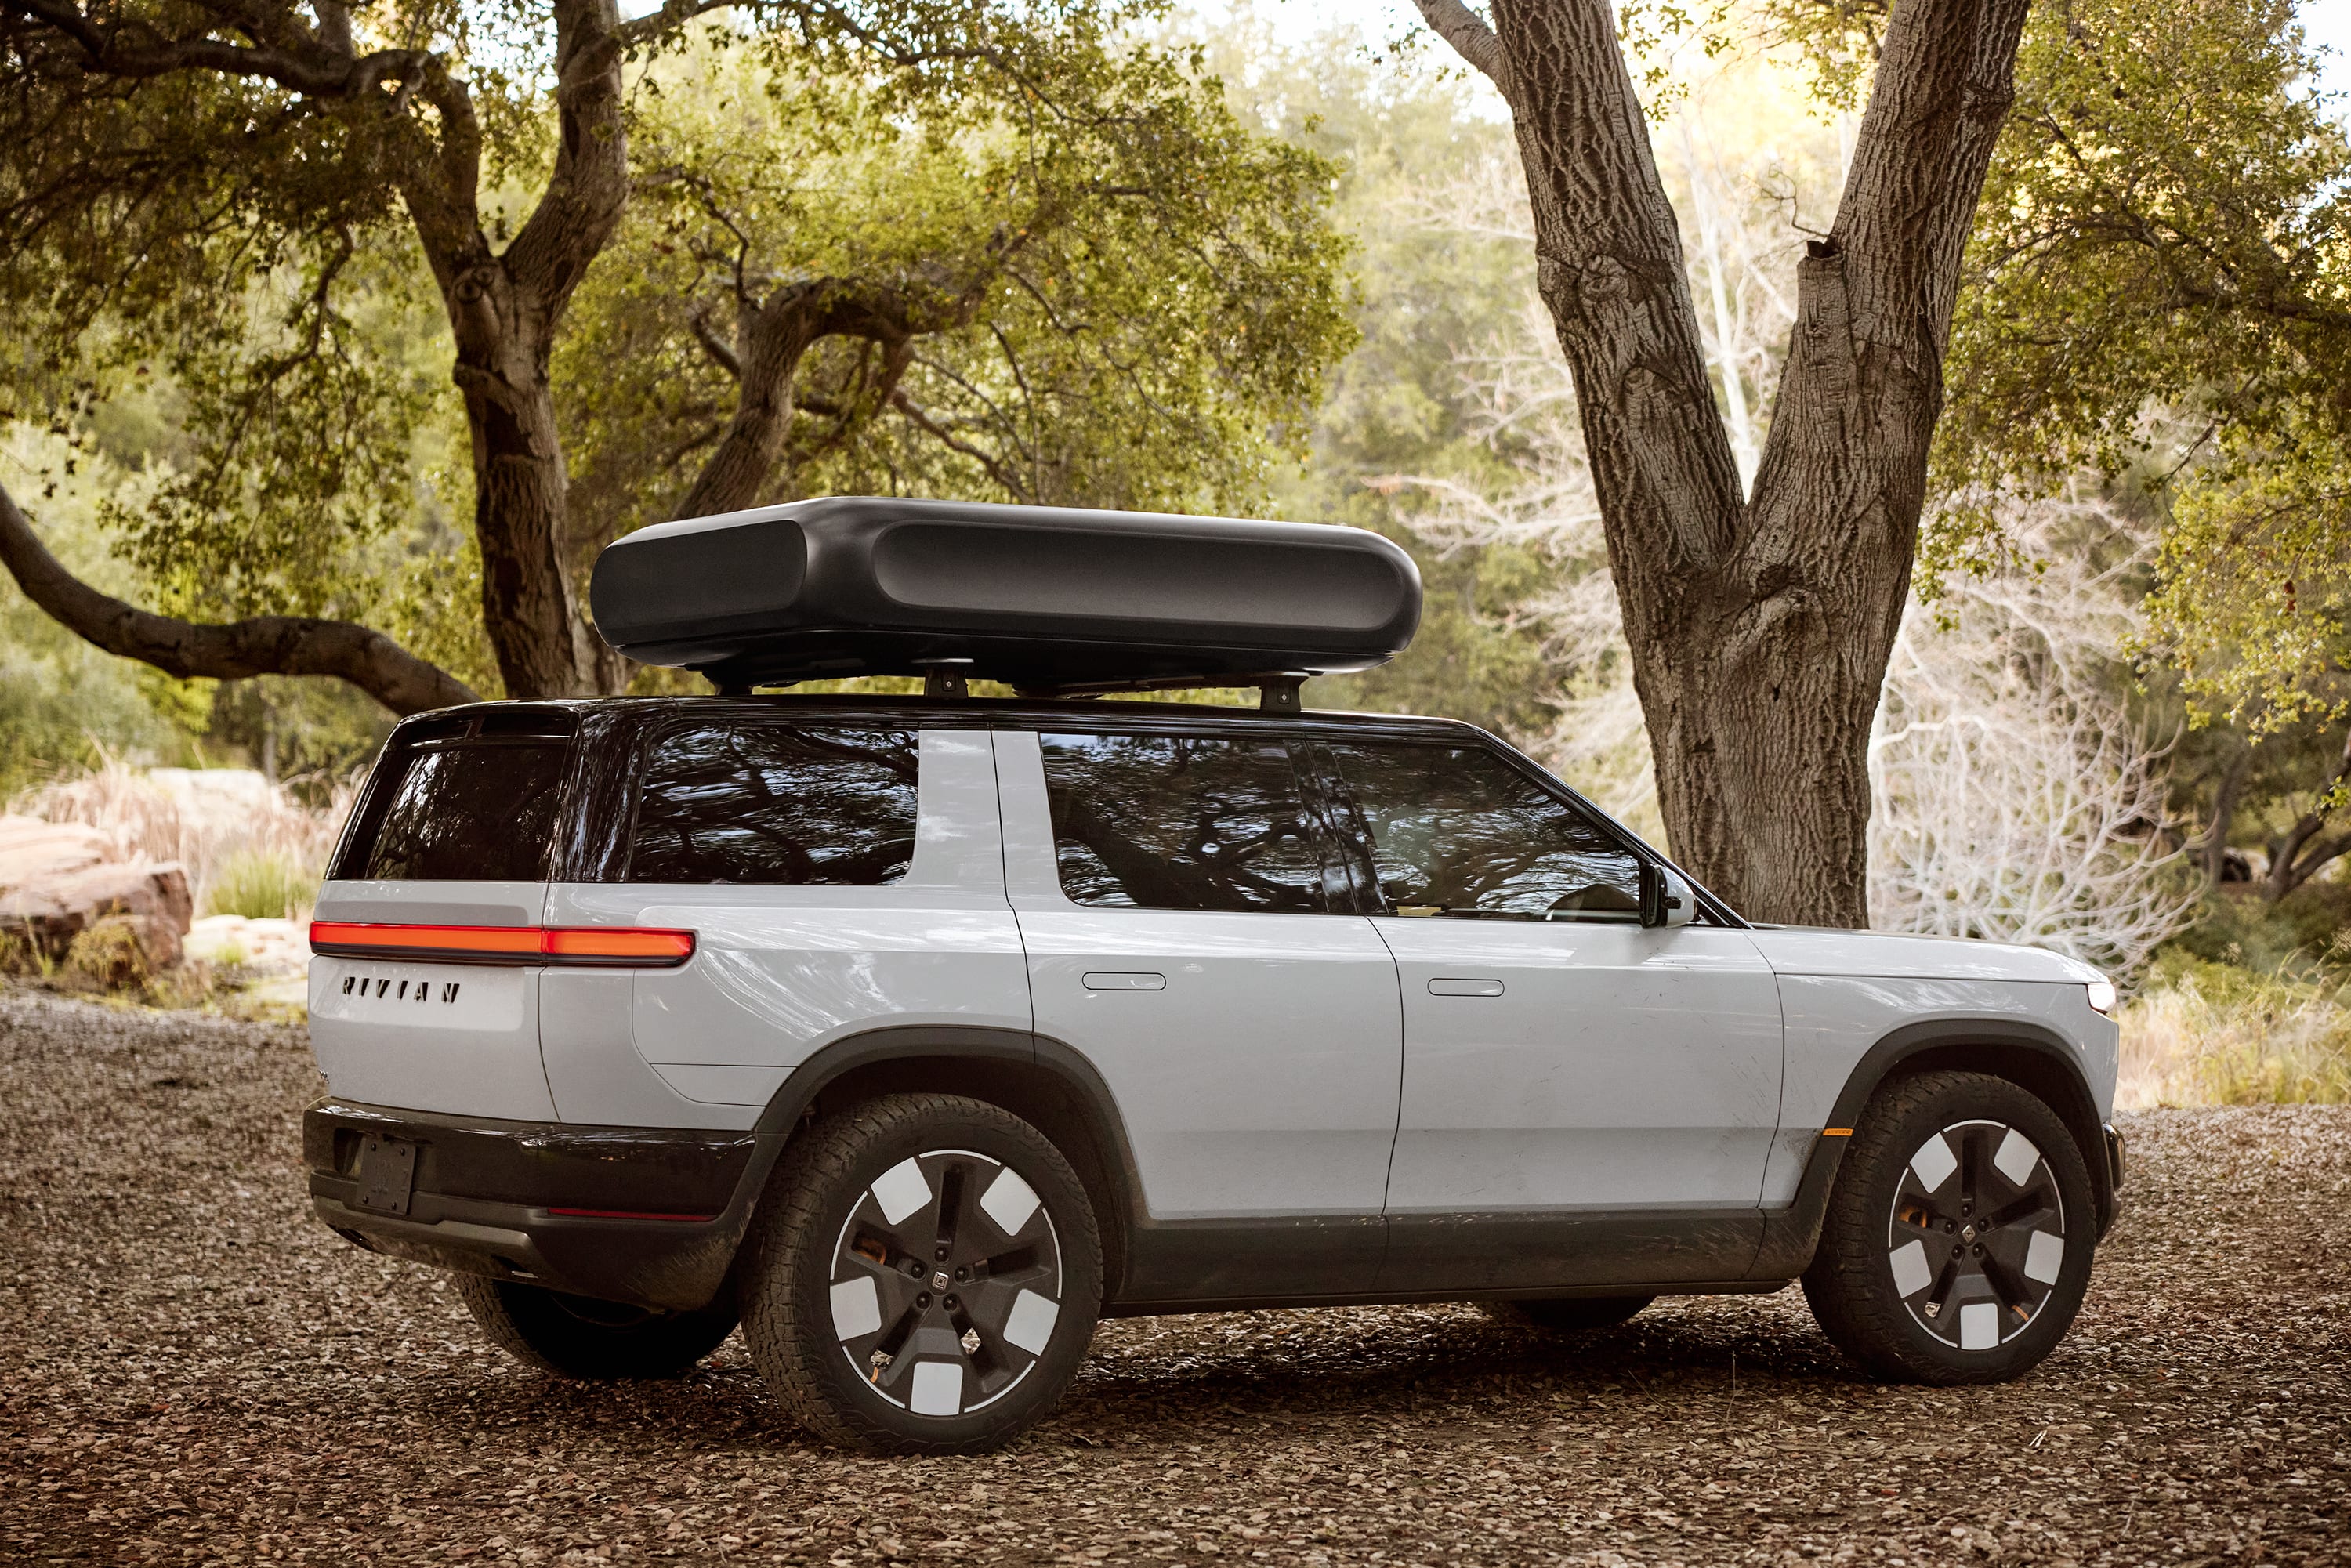
Rivian makes electric pickup trucks and SUVs for people who love the outdoors. The company also builds delivery vans to help businesses move goods without using gasoline. These vehicles use battery power to protect nature while handling tough jobs and long trips.

What Rivian Builds

  • Consumer Vehicles: Pickup trucks and SUVs equipped with internal software and hardware; includes the flagship R1 platform and future R2 and R3 models.
  • Commercial Vehicles: Electric delivery vans designed for business fleets; includes the 500 and 700 cubic foot variants optimized for local deliveries.
  • Software and Services: Value-added subscriptions and technical support; covers the Volkswagen Group joint venture, vehicle repairs, and charging network access.

New Moves and Big Partners

  • Formed an equally-owned joint venture in November 2024 with Volkswagen Group to develop next-generation vehicle software and electrical systems.
  • Licensed electrical architecture and software technology to Volkswagen Group in 2024 for an initial $1.3 billion payment.
  • Secured a term loan facility from the United States Department of Energy in January 2025 to support manufacturing expansion.
  • Launched the Connect+ subscription service and released a Universal Hands Free driving feature in late 2025.

What Makes the Company Different

Rivian controls its entire technology stack, including vehicle software, electronics, and the propulsion systems that move the wheels. This vertical integration allows the company to send wireless updates that improve how the vehicles drive and function over time.

Financial Performance

  • Revenue reached $1.3 billion in Q4 2025, a decrease of 25.8% compared to the same period in 2024.
  • Net loss for the full year 2025 was $3.6 billion, an improvement from the $4.7 billion loss reported in 2024.
  • Gross profit was $120 million in Q4 2025, down 29.4% from $170 million in Q4 2024.
  • Free cash flow was negative $1.1 billion in Q4 2025, compared to a positive $856 million in Q4 2024.

Bottom Line

Rivian has transitioned from a niche startup to a multi-platform manufacturer with significant global partnerships. The company continues to refine its manufacturing processes while expanding its technology through a major software alliance with Volkswagen Group.

AI Generated • Apr 20, 2026

Industry

Automobiles

Employees

15,232

CEO

Robert Joseph Scaringe, PhD

Headquarters

Irvine, CA 92606, US

RIVN Financials

Key Financial Metrics (TTM)

Gross Margin

7.51%

Operating Margin

-60.05%

Net Income Margin

-54.95%

Return on Equity

-67.49%

Return on Capital

-31.96%

Return on Assets

-21.35%

Earnings Yield

-17.45%

Dividend Yield

0.00%

Payout Ratio

0.00%

Stock Overview

Market Cap

$21.40BMarket cap calculated using publicly traded shares outstanding only. Does not include unlisted, private, or dual-class non-traded shares. Implied market cap may vary.

Shares Outstanding

1.45B

Volume

17.85M

Avg. Volume

33.11M

Financials (TTM)

Gross Profit

$442.00M

Operating Income

-$3.53B

EBITDA

-$2.14B

Operating Cash Flow

-$1.85B

Capital Expenditure

-$1.64B

Free Cash Flow

-$3.49B

Cash & ST Invst.

$5.31B

Total Debt

$5.35B

Rivian Automotive Performance Analysis

Rivian Automotive annual revenue and year-over-year revenue growth by fiscal year
Fiscal yearPeriod endRevenueYoY growth
20222022-12-31USD 1,658,000,0002914.5%
20232023-12-31USD 4,434,000,000167.4%
20242024-12-31USD 4,970,000,00012.1%
20252025-12-31USD 5,387,000,0008.4%
Rivian Automotive sequential (quarter-over-quarter) revenue growth by fiscal quarter
Fiscal quarterPeriod endQoQ growth
Q32025-09-3019.6%
Q42025-12-31-17.5%
Q12026-03-317.4%
Q22026-06-3020.1%
Rivian Automotive annual diluted earnings per share and year-over-year EPS growth by fiscal year
Fiscal yearPeriod endDiluted EPSYoY growth
20222022-12-31USD -7.4042.1%
20232023-12-31USD -5.74-22.4%
20242024-12-31USD -4.69-18.3%
20252025-12-31USD -3.07-34.4%
Rivian Automotive sequential (quarter-over-quarter) diluted earnings per share growth by fiscal quarter
Fiscal quarterPeriod endQoQ growth
Q32025-09-301.0%
Q42025-12-3131.2%
Q12026-03-3150.0%
Q22026-06-30-90.9%

Revenue Growth Rate

Annual and quarterly growth comparison

Earnings Per Share Growth Rate

Annual and quarterly EPS growth comparison

Quarterly Performance

Name
Q2 2026YOY CHG

Revenue

$1.66B

+27.2%

Gross Profit

$179.00M

+186.9%

Gross Margin

10.80%

N/A

Market Cap

$21.40BMarket cap calculated using publicly traded shares outstanding only. Does not include unlisted, private, or dual-class non-traded shares. Implied market cap may vary.

N/A

Market Cap/Employee

$1.40M

N/A

Employees

15,232

N/A

Net Income

-$833.00M

+25.4%

EBITDA

-$533.00M

+37.1%

Quarterly Fundamentals

Name
Q2 2026YOY CHG

Total Cash

$5.31B

-29.3%

Total Debt

$5.35B

-15.5%

Accounts Receivable

$370.00M

+45.7%

Inventory

$1.66B

-21.0%

Long Term Debt

$5.24B

+6.9%

Short Term Debt

$117.00M

-91.9%

Return on Assets

-21.35%

N/A

Return on Invested Capital

-30.67%

N/A

Free Cash Flow

-$849.00M

-113.3%

Operating Cash Flow

-$487.00M

-860.9%

Other Investments to Explore

People Also Watch

Symbol / CompanyPricePrice Chg
MGAMagna International Inc.
$71.00+1.04%
BBYBest Buy Co., Inc.
$89.22+2.23%
GPCGenuine Parts Company
$134.50+1.98%
YUMCYum China Holdings, Inc.
$47.57+1.52%

Trending Stocks

Symbol / CompanyPricePrice Chg
MRNAModerna
$170.30+1.70%
BITOProShares Trust - ProShares Bitcoin ETF
$9.24+0.06%
IBITiShares Bitcoin Trust
$38.74+0.06%
TSLLDirexion Shares ETF Trust - Direxion Daily Tsla Bull 2x ETF
$9.03+0.06%

Questions About RIVN

What is the current price of Rivian Automotive?

Rivian Automotive is trading at $15.63 per share.

What is the 52-week range for Rivian Automotive?

Over the past 52 weeks, Rivian Automotive has traded between $11.84 and $22.69.

How much debt does Rivian Automotive have?

As of the most recent reporting period, Rivian Automotive reported total debt of $5.35B.

How much cash does Rivian Automotive have on hand?

Rivian Automotive reported $3.59B in cash and cash equivalents in its most recent financial results.

What is Rivian Automotive’s dividend yield?

Rivian Automotive does not currently have a dividend yield.

Premium Investing Services

Invest better with The Motley Fool. Get stock recommendations, portfolio guidance, and more from The Motley Fool's premium services.