Accessibility Menu
Roku logo

Roku(NASDAQ) ROKU

Market Cap$21.63BMarket cap calculated using publicly traded shares outstanding only. Does not include unlisted, private, or dual-class non-traded shares. Implied market cap may vary.
Since IPO (2017)+517%
5 Year-66%
1 Year+54%
1 Month+3%
$145.93
+0.63%
+0.92Today
After hours$145.98+$0.05 (+0.03%)
Roku last closing stock price
MetricPriceDate
Last closeUSD 145.012026-07-31
Roku stock price return by period
PeriodPrice returnPrice at period startPeriod start date
1 week+2.14%USD 141.972026-07-24
1 month+3.2%USD 140.512026-07-01
3 month+17.34%USD 123.582026-05-01
Year to date+33.66%USD 108.492025-12-31
1 year+54%USD 94.162025-07-31
3 year+48.74%USD 97.492023-08-01
5 year-66.14%USD 428.312021-07-30
Since inception+517.06%USD 23.502017-09-28

Roku Financials at a Glance

Market Cap

$21.63BMarket cap calculated using publicly traded shares outstanding only. Does not include unlisted, private, or dual-class non-traded shares. Implied market cap may vary.

Revenue (TTM)

$4.97B

Net Income (TTM)

$201.49M

EPS (TTM)

$1.33

P/E Ratio

109.67

Dividend

$0.00

Beta (Volatility)

2.07 (High)

Price

$145.93

Volume

3,244,219

Open

$145.85

Previous Close

$145.84

Daily Range

$145.72 - $147.12

52-Week Range

$78.53 - $148.88

Estimated Earnings Date

Aug 6, 2026

ROKU: Motley Fool Moneyball Superscore

70

Our CEO Is Handing Members His Secret Weapon

It's called Motley Fool Moneyball, our new proprietary AI tool

We spent over half a million dollars in R&D to build a tool that makes stock research faster, sharper, and smarter. Our analysts use it every day, and now, you can too.

Get Access Now

About Roku

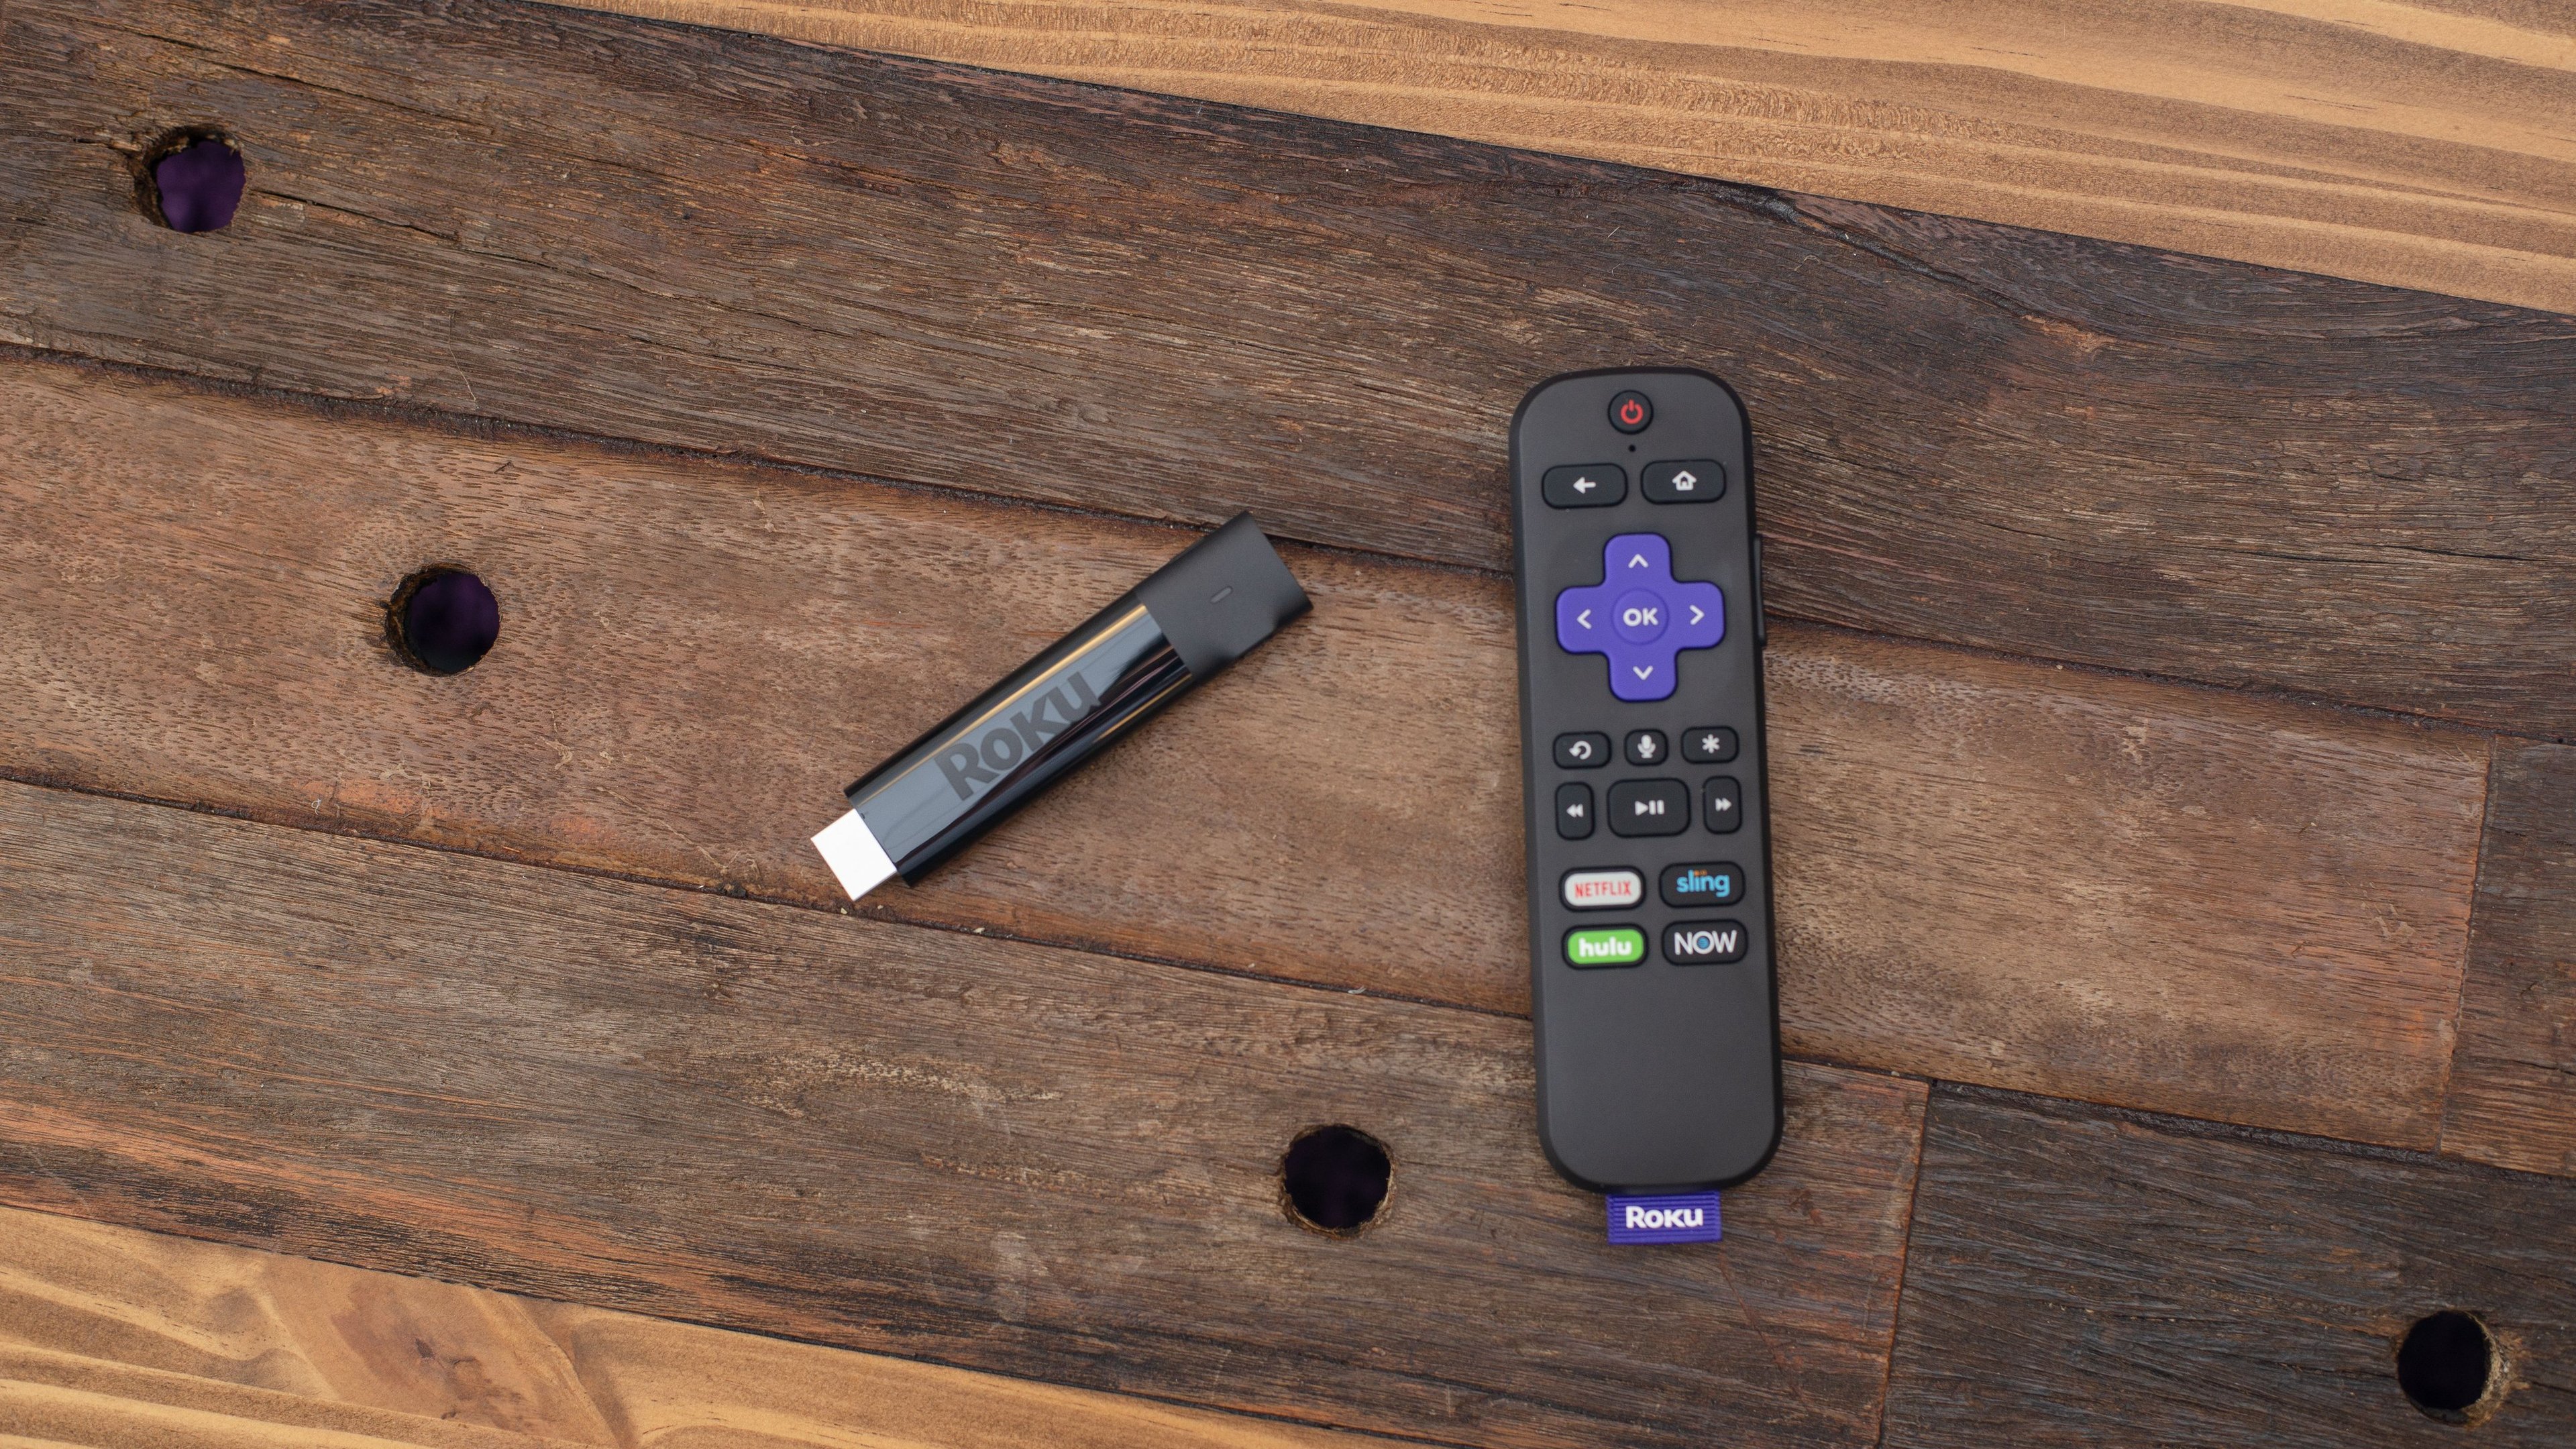
Roku makes devices that let people stream movies and shows on their TVs. The company helps advertisers reach viewers who no longer watch traditional cable television. It also helps media companies find and bill customers for their streaming services.

What Roku Sells

  • Platform Services: Digital advertising sales, subscription sharing, and branded buttons on remote controls.
  • Streaming Devices: Hardware including streaming sticks, players, and audio products like soundbars and speakers.
  • Roku-made TVs: Television sets designed and sold directly by the company, including the Select, Plus, and Pro Series.
  • Smart Home Products: Security cameras, video doorbells, and lighting systems managed through a mobile application.

Strategic Moves and Growth

  • Launched Roku-made TVs in 2023 to control both hardware and software design.
  • Acquired Frndly TV in May 2025 to add a live-channel subscription service to its portfolio.
  • Introduced Howdy in August 2025, an ad-free subscription service priced at $2.99 per month.
  • Expanded the player lineup in 2025 by launching new Streaming Stick models in international markets like Canada and Mexico.

A Different Way to Watch

Roku uses its own operating system built specifically for television rather than adapting mobile software. This allows the company to run its platform on low-cost hardware while providing a unified home screen for all streaming apps.

Financial Performance

  • Revenue reached $1.4 billion in Q4 2025, up 16.1% year-over-year.
  • Net income was $80.5 million in Q4 2025, up 326.4% from a loss in Q4 2024.
  • Free cash flow grew to $221.6 million in Q4 2025, up 188.5% from the previous year.
  • Streaming hours on the platform increased to 145.6 billion hours for the full year 2025.

Bottom Line

Roku has transitioned from a hardware manufacturer into a massive digital advertising and content distribution platform. By owning the operating system, the company has become a central gatekeeper in the shift from cable to internet-based television.

AI Generated • Apr 20, 2026

Industry

Entertainment

Employees

3,600

CEO

Anthony J. Wood

Headquarters

San Jose, CA 95110, US

ROKU Financials

Key Financial Metrics (TTM)

Gross Margin

44.19%

Operating Margin

2.09%

Net Income Margin

4.06%

Return on Equity

7.64%

Return on Capital

-0.16%

Return on Assets

4.63%

Earnings Yield

0.91%

Dividend Yield

0.00%

Payout Ratio

0.00%

Stock Overview

Market Cap

$21.63BMarket cap calculated using publicly traded shares outstanding only. Does not include unlisted, private, or dual-class non-traded shares. Implied market cap may vary.

Shares Outstanding

148.34M

Volume

3.24M

Avg. Volume

4.25M

Financials (TTM)

Gross Profit

$2.19B

Operating Income

$103.88M

EBITDA

$420.10M

Operating Cash Flow

$659.20M

Capital Expenditure

-$6.48M

Free Cash Flow

$652.71M

Cash & ST Invst.

$2.38B

Total Debt

$501.12M

Roku Performance Analysis

Roku annual revenue and year-over-year revenue growth by fiscal year
Fiscal yearPeriod endRevenueYoY growth
20222022-12-31USD 3,126,534,00013.1%
20232023-12-31USD 3,484,619,00011.5%
20242024-12-31USD 4,112,898,00018.0%
20252025-12-31USD 4,737,251,00015.2%
Roku sequential (quarter-over-quarter) revenue growth by fiscal quarter
Fiscal quarterPeriod endQoQ growth
Q22025-06-308.9%
Q32025-09-309.0%
Q42025-12-3115.2%
Q12026-03-31-10.5%
Roku annual diluted earnings per share and year-over-year EPS growth by fiscal year
Fiscal yearPeriod endDiluted EPSYoY growth
20222022-12-31USD -3.62N/A
20232023-12-31USD -5.0138.6%
20242024-12-31USD -0.89-82.2%
20252025-12-31USD 0.59N/A
Roku sequential (quarter-over-quarter) diluted earnings per share growth by fiscal quarter
Fiscal quarterPeriod endQoQ growth
Q22025-06-30136.8%
Q32025-09-30128.6%
Q42025-12-31231.3%
Q12026-03-317.5%

Revenue Growth Rate

Annual and quarterly growth comparison

Earnings Per Share Growth Rate

Annual and quarterly EPS growth comparison

Quarterly Performance

Name
Q1 2026YOY CHG

Revenue

$1.25B

+22.4%

Gross Profit

$564.94M

+26.9%

Gross Margin

45.24%

N/A

Market Cap

$21.63BMarket cap calculated using publicly traded shares outstanding only. Does not include unlisted, private, or dual-class non-traded shares. Implied market cap may vary.

N/A

Market Cap/Employee

$6.01M

N/A

Employees

3,600

N/A

Net Income

$85.70M

+412.4%

EBITDA

$165.29M

+375.9%

Quarterly Fundamentals

Name
Q1 2026YOY CHG

Total Cash

$2.38B

+5.5%

Total Debt

$501.12M

-13.2%

Accounts Receivable

$752.59M

+15.7%

Inventory

$101.29M

-25.1%

Long Term Debt

$412.71M

-16.8%

Short Term Debt

$88.41M

+9.1%

Return on Assets

4.63%

N/A

Return on Invested Capital

3.25%

N/A

Free Cash Flow

$196.01M

+43.3%

Operating Cash Flow

$199.14M

+43.5%

Other Investments to Explore

People Also Watch

Symbol / CompanyPricePrice Chg
OMCOmnicom Group Inc.
$79.27+0.72%
NWSANews Corporation
$27.94+1.38%
TKOTKO Group Holdings, Inc.
$183.91+1.16%
WMGWarner Music Group Corp.
$25.10-3.31%

Trending Stocks

Symbol / CompanyPricePrice Chg
SQQQProShares Trust - ProShares UltraPro Short Qqq
$41.43-0.05%
NVDANvidia
$206.64+0.03%
TSLLDirexion Shares ETF Trust - Direxion Daily Tsla Bull 2x Shares
$7.81+0.07%
INTCIntel
$91.00+0.01%

Questions About ROKU

What is the current price of Roku?

Roku is trading at $145.84 per share.

What is the 52-week range for Roku?

Over the past 52 weeks, Roku has traded between $78.53 and $148.88.

How much debt does Roku have?

As of the most recent reporting period, Roku reported total debt of $501.12M.

How much cash does Roku have on hand?

Roku reported $1.65B in cash and cash equivalents in its most recent financial results.

What is Roku’s dividend yield?

Roku does not currently have a dividend yield.

Premium Investing Services

Invest better with The Motley Fool. Get stock recommendations, portfolio guidance, and more from The Motley Fool's premium services.