Accessibility Menu
Corning logo

Corning(NYSE) GLW

Market Cap$129.07BMarket cap calculated using publicly traded shares outstanding only. Does not include unlisted, private, or dual-class non-traded shares. Implied market cap may vary.
Since IPO (1968)+8,248%
5 Year+324%
1 Year+133%
1 Month-3%
Premium Feature
Moneyball Superscore
85/100
$149.95
-0.99%
-1.50Today
After hours$149.39-$0.56 (-0.37%)
Corning last closing stock price
MetricPriceDate
Last closeUSD 149.842026-08-21
Corning stock price return by period
PeriodPrice returnPrice at period startPeriod start date
1 week-9.73%USD 165.992026-08-14
1 month-2.74%USD 154.062026-07-22
3 month-22.66%USD 193.752026-05-22
Year to date+71.71%USD 87.262025-12-31
1 year+133.44%USD 64.192025-08-21
3 year+402.55%USD 29.822023-08-22
5 year+324.43%USD 35.302021-08-20
Since inception+8,248.01%USD 1.791968-01-02

Corning Financials at a Glance

Market Cap

$129.07BMarket cap calculated using publicly traded shares outstanding only. Does not include unlisted, private, or dual-class non-traded shares. Implied market cap may vary.

Revenue (TTM)

$16.96B

Net Income (TTM)

$1.90B

EPS (TTM)

$2.18

P/E Ratio

68.73

Dividend

$1.12

Beta (Volatility)

1.22 (Average)

Price

$149.95

Volume

6,179,020

Open

$153.85

Previous Close

$149.84

Daily Range

$148.05 - $155.48

52-Week Range

$65.75 - $271.78

Estimated Earnings Date

Oct 27, 2026

GLW: Motley Fool Moneyball Superscore

85

Our CEO Is Handing Members His Secret Weapon

It's called Motley Fool Moneyball, our new proprietary AI tool

We spent over half a million dollars in R&D to build a tool that makes stock research faster, sharper, and smarter. Our analysts use it every day, and now, you can too.

Get Access Now

About Corning

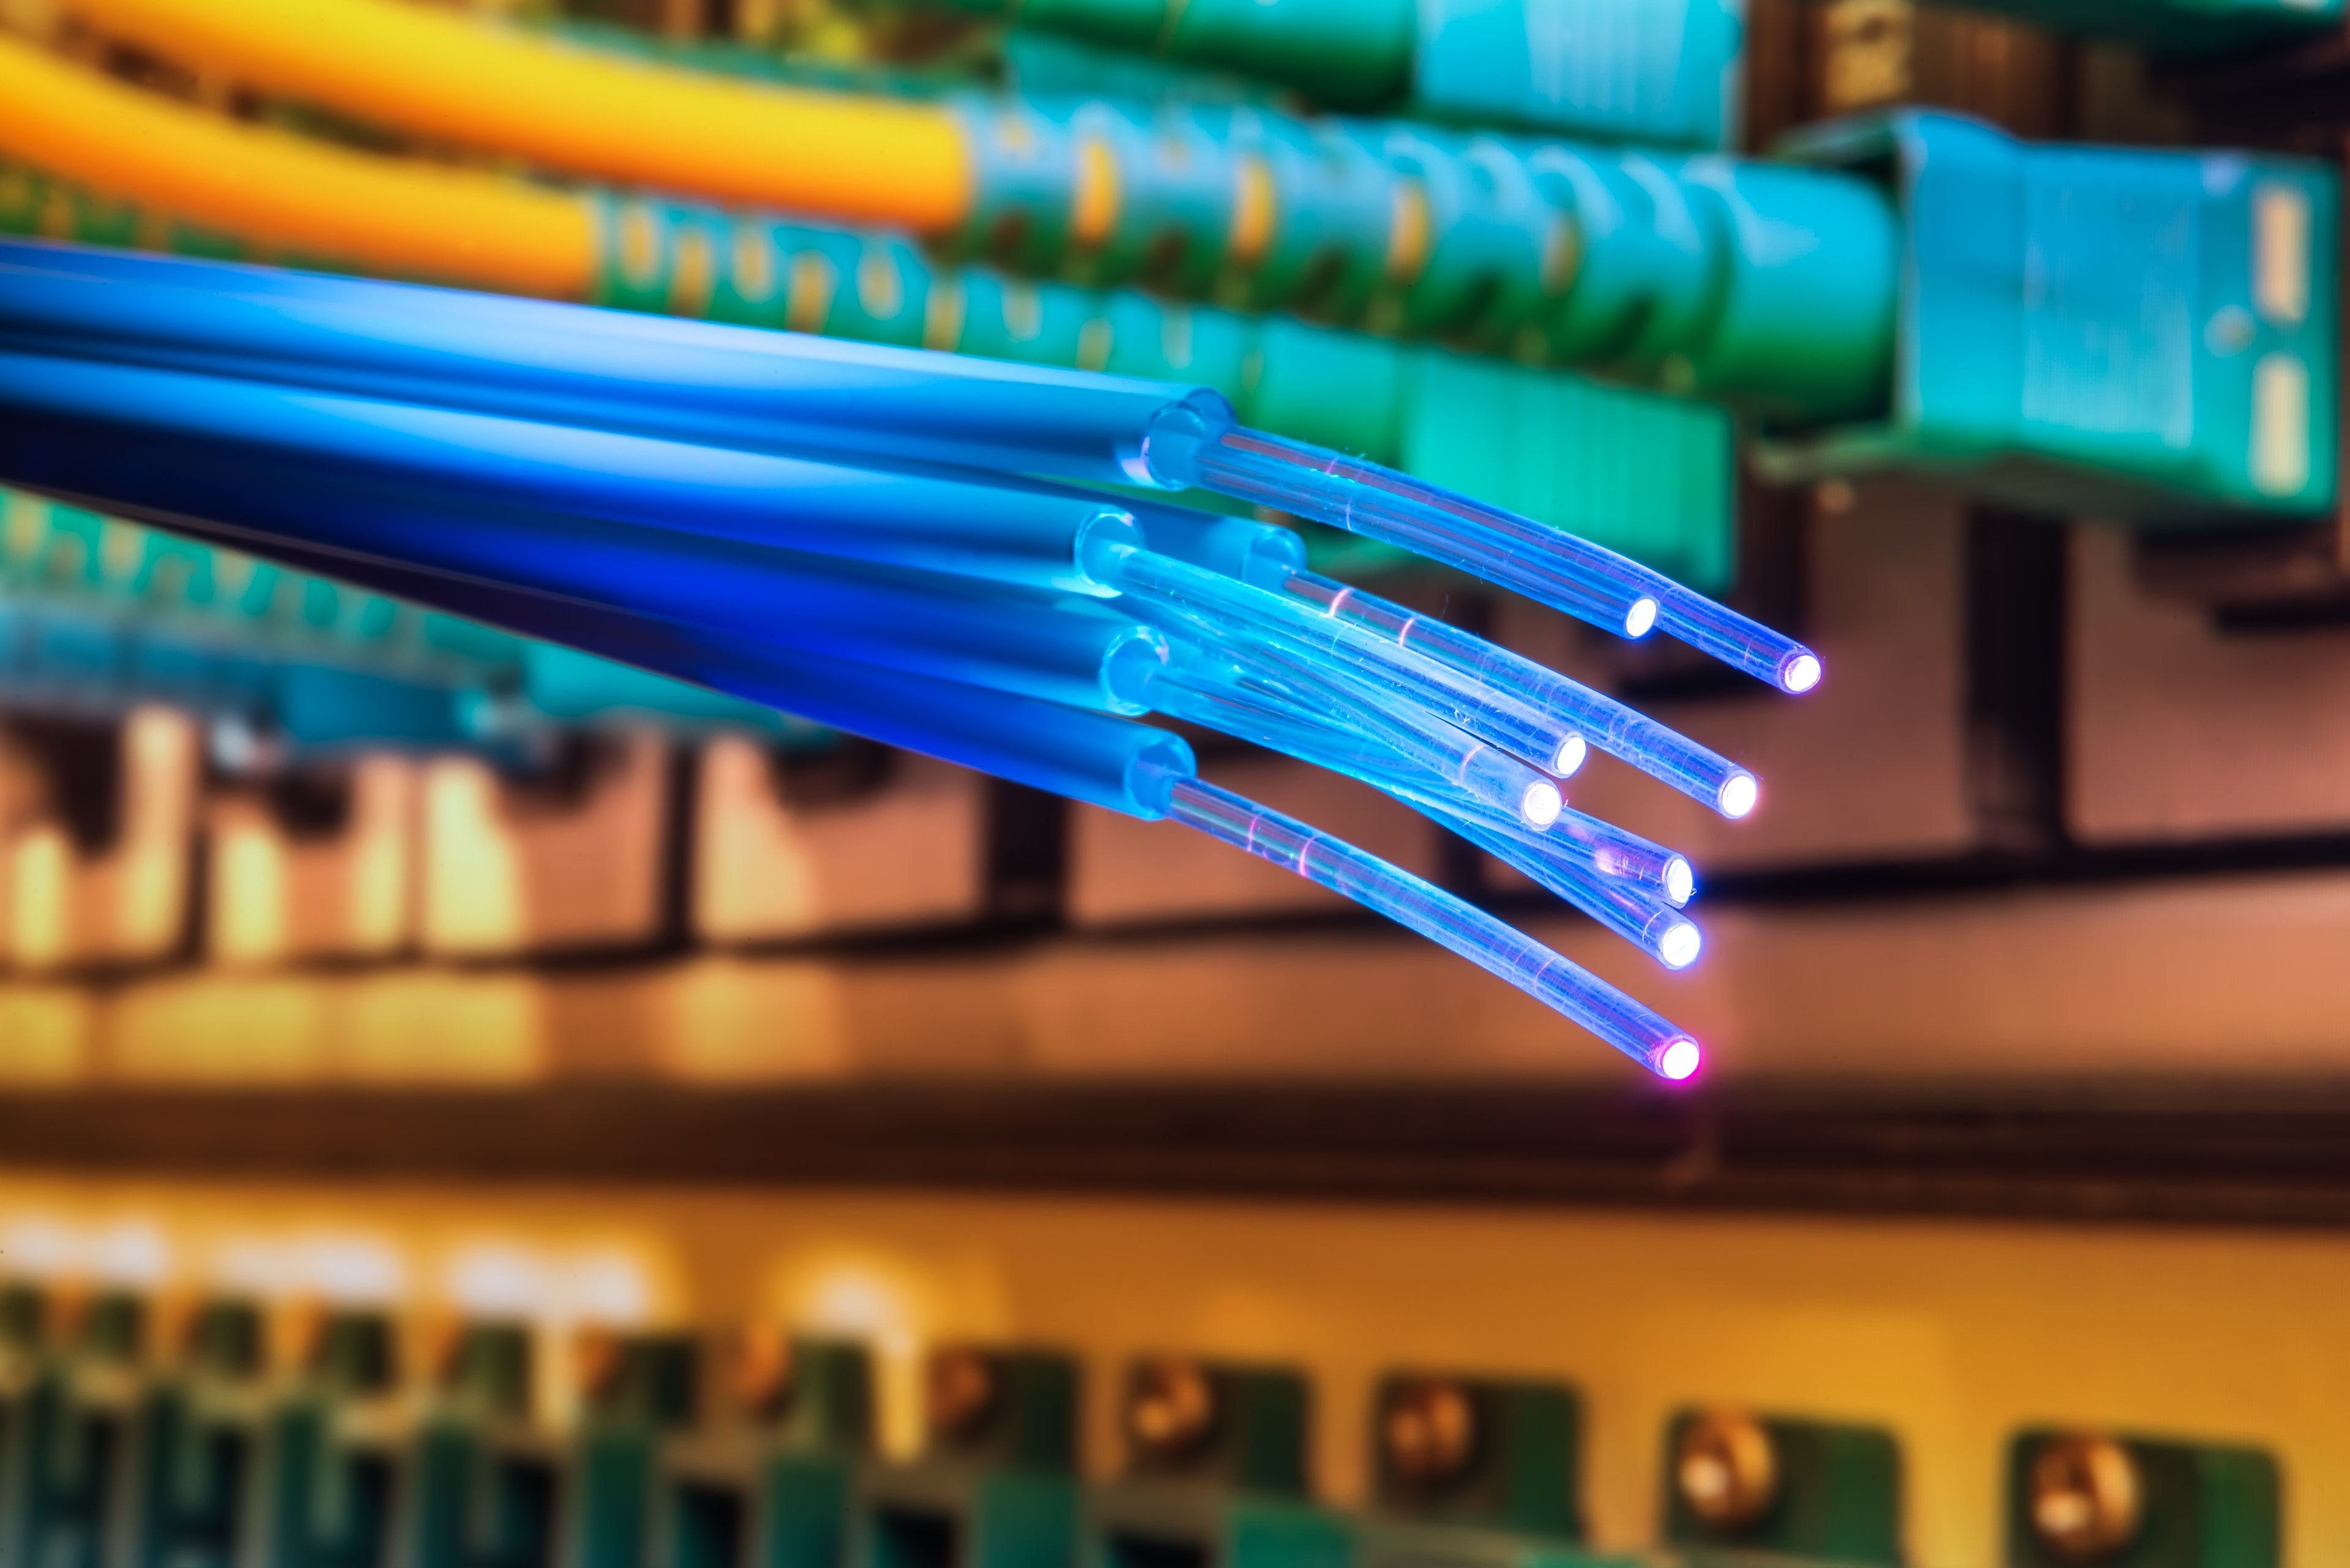
Corning Incorporated makes tough glass for your smartphone screen. The company builds fiber optic cables that connect people to the internet. It also produces ceramic parts that clean the air from car exhausts.

Glass, Fiber, and Solar Tech

  • Optical Communications: Fiber optic cables and connectivity tools for phone networks and Artificial Intelligence (AI) data centers; generated $2.1 billion in net sales for the three months ended June 30, 2026.
  • Glass Innovations: Advanced glass for Liquid Crystal Display (LCD) and Organic Light-Emitting Diode (OLED) screens and mobile devices; generated $1.5 billion in net sales for the three months ended June 30, 2026.
  • Automotive: Ceramic parts for emissions control and technical glass for vehicle interiors; generated $471 million in net sales for the three months ended June 30, 2026.
  • Solar: Silicon materials for solar panels and semiconductors; generated $438 million in net sales for the three months ended June 30, 2026.

Steps Toward Higher Profits

  • Launched the Springboard plan in the third quarter of 2023 to grow sales and expand profitability.
  • Revised the business segment structure in 2026 to focus on Glass Innovations and Solar.
  • Increased capital spending to $754 million in the first half of 2026 to expand manufacturing capacity.
  • Established a share repurchase agreement with Samsung Display Co. to buy back up to 22 million shares through 2027.

Masters of Material Science

Corning applies expertise in glass science and ceramics to solve technical problems for global industries. The company maintains deep relationships with industry leaders to develop specialized manufacturing processes.

A Strong Start to 2026

  • Net sales were $4.5 billion for the three months ended June 30, 2026, up 17% year over year.
  • Core net income was $680 million for the three months ended June 30, 2026, up 30% year over year.
  • Optical Communications net sales reached $2.1 billion for the three months ended June 30, 2026, up 32% year over year.
  • Received a $1.0 billion upfront customer deposit related to a long-term supply agreement in the first half of 2026.

Corning's Path Forward

Corning has transformed from a traditional glassmaker into a diversified innovator in optical and material sciences. Its ability to apply core manufacturing skills across different industries helps it capture new technology trends.

AI Generated • Aug 4, 2026

Industry

Electronic Equipment, Instruments and Components

Employees

67,200

CEO

Wendell P. Weeks, MBA

Headquarters

Corning, NY 14831, US

GLW Financials

Key Financial Metrics (TTM)

Gross Margin

36.32%

Operating Margin

15.47%

Net Income Margin

11.20%

Return on Equity

15.93%

Return on Capital

10.58%

Return on Assets

5.77%

Earnings Yield

1.45%

Dividend Yield

0.75%

Payout Ratio

52.16%

Stock Overview

Market Cap

$129.07BMarket cap calculated using publicly traded shares outstanding only. Does not include unlisted, private, or dual-class non-traded shares. Implied market cap may vary.

Shares Outstanding

861.39M

Volume

6.18M

Avg. Volume

14.07M

Financials (TTM)

Gross Profit

$6.16B

Operating Income

$2.62B

EBITDA

$3.90B

Operating Cash Flow

$3.92B

Capital Expenditure

-$1.52B

Free Cash Flow

$2.40B

Cash & ST Invst.

$2.50B

Total Debt

$9.38B

Corning Performance Analysis

Corning annual revenue and year-over-year revenue growth by fiscal year
Fiscal yearPeriod endRevenueYoY growth
20222022-12-31USD 14,137,000,0000.5%
20232023-12-31USD 12,588,000,000-11.0%
20242024-12-31USD 13,136,000,0004.4%
20252025-12-31USD 15,629,000,00019.0%
Corning sequential (quarter-over-quarter) revenue growth by fiscal quarter
Fiscal quarterPeriod endQoQ growth
Q32025-09-306.2%
Q42025-12-312.8%
Q12026-03-31-1.7%
Q22026-06-308.7%
Corning annual diluted earnings per share and year-over-year EPS growth by fiscal year
Fiscal yearPeriod endDiluted EPSYoY growth
20222022-12-31USD 1.5420.1%
20232023-12-31USD 0.68-56.0%
20242024-12-31USD 0.58-13.9%
20252025-12-31USD 1.83214.7%
Corning sequential (quarter-over-quarter) diluted earnings per share growth by fiscal quarter
Fiscal quarterPeriod endQoQ growth
Q32025-09-30-7.4%
Q42025-12-3126.0%
Q12026-03-31-31.7%
Q22026-06-3048.8%

Revenue Growth Rate

Annual and quarterly growth comparison

Earnings Per Share Growth Rate

Annual and quarterly EPS growth comparison

Quarterly Performance

Name
Q2 2026YOY CHG

Revenue

$4.51B

+16.6%

Gross Profit

$1.63B

+17.0%

Gross Margin

36.14%

N/A

Market Cap

$129.07BMarket cap calculated using publicly traded shares outstanding only. Does not include unlisted, private, or dual-class non-traded shares. Implied market cap may vary.

N/A

Market Cap/Employee

$1.92M

N/A

Employees

67,200

N/A

Net Income

$559.00M

+19.2%

EBITDA

$1.13B

+12.6%

Quarterly Fundamentals

Name
Q2 2026YOY CHG

Total Cash

$2.50B

+67.9%

Total Debt

$9.38B

+10.4%

Accounts Receivable

$2.93B

+27.6%

Inventory

$3.43B

+11.1%

Long Term Debt

$8.62B

+13.3%

Short Term Debt

$758.00M

-14.5%

Return on Assets

5.77%

N/A

Return on Invested Capital

9.74%

N/A

Free Cash Flow

$1.30B

+223.7%

Operating Cash Flow

$1.72B

+142.5%

Other Investments to Explore

People Also Watch

Symbol / CompanyPricePrice Chg
FTNTFortinet, Inc.
$153.51+1.80%
MSIMotorola Solutions, Inc.
$480.47+1.44%
SNPSSynopsys, Inc.
$397.87-0.01%
TELTE Connectivity plc
$203.53+1.49%

Trending Stocks

Symbol / CompanyPricePrice Chg
TSLLDirexion Shares ETF Trust - Direxion Daily Tsla Bull 2x ETF
$9.77+0.10%
IBITiShares Bitcoin Trust
$43.68+0.06%
BITOProShares Trust - ProShares Bitcoin ETF
$10.41+0.06%
MARAMara Holdings
$11.26+0.01%

Questions About GLW

What is the current price of Corning?

Corning is trading at $149.84 per share.

What is the 52-week range for Corning?

Over the past 52 weeks, Corning has traded between $65.75 and $271.78.

How much debt does Corning have?

As of the most recent reporting period, Corning reported total debt of $9.38B.

How much cash does Corning have on hand?

Corning reported $2.51B in cash and cash equivalents in its most recent financial results.

What is Corning’s dividend yield?

Corning currently has a dividend yield of 0.75%.

Premium Investing Services

Invest better with The Motley Fool. Get stock recommendations, portfolio guidance, and more from The Motley Fool's premium services.