Fair Isaac
(NYSE) FICO
Fair Isaac Financials at a Glance
Market Cap
$23.98B
Revenue (TTM)
$2.06B
Net Income (TTM)
$657.79M
EPS (TTM)
$27.01
P/E Ratio
37.43
Dividend
$0.00
Beta (Volatility)
1.12 (Average)
Dividend
$0.00
Beta (Volatility)
1.12 (Average)
Price
$1011.71
Volume
17,705
Open
$1036.40
Price
$1011.71
Volume
17,705
Open
$1036.40
Previous Close
$1011.71
Daily Range
$999.99 - $1036.40
52-Week Range
$969.32 - $2217.60
Dividend
$0.00
Beta (Volatility)
1.12 (Average)
Price
$1011.71
Volume
17,705
Open
$1036.40
Previous Close
$1011.71
Daily Range
$999.99 - $1036.40
52-Week Range
$969.32 - $2217.60
FICO News

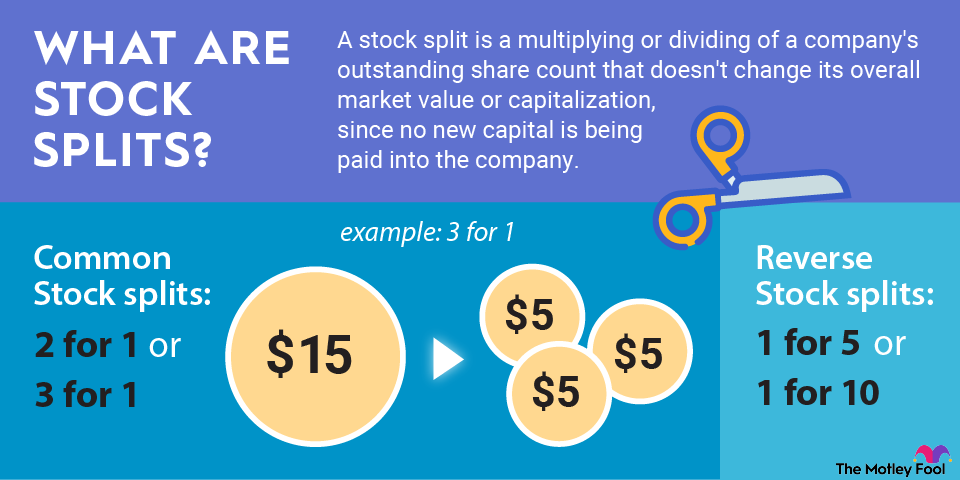
Upcoming Stock Splits in 2026

5 Best Wide-Moat Stocks to Buy in 2026


FICO: Motley Fool Moneyball Superscore
Our CEO Is Handing Members His Secret Weapon
It's called Motley Fool Moneyball, our new proprietary AI tool
We spent over half a million dollars in R&D to build a tool that makes stock research faster, sharper, and smarter. Our analysts use it every day, and now, you can too.
Get Access NowAbout Fair Isaac
Industry
Software
Sector
Information TechnologyEmployees
3,811
CEO
Will Lansing
Website
www.fico.comHeadquarters
Bozeman, MT 59715, US
FICO Financials
Key Financial Metrics (TTM)
Gross Margin
83%
Operating Margin
47%
Net Income Margin
32%
Return on Equity
0%
Return on Capital
89%
Return on Assets
35%
Earnings Yield
2.67%
Dividend Yield
0.00%
Payout Ratio
0.00%
Stock Overview
Market Cap
$23.98B
Shares Outstanding
23.72M
Volume
17.70K
Short Interest
0.00%
Avg. Volume
334.54K
Financials (TTM)
Gross Profit
$1.64B
Operating Income
$924.85M
EBITDA
$951.19M
Operating Cash Flow
$778.81M
Capital Expenditure
$8.92M
Free Cash Flow
$769.88M
Cash & ST Invst.
$134.14M
Total Debt
$3.07B
Fair Isaac Performance Analysis
Revenue Growth Rate
Annual and quarterly growth comparisonEarnings Per Share Growth Rate
Annual and quarterly EPS growth comparisonQuarterly Performance
Revenue
$511.96M
+16.4%
Gross Profit
$424.70M
+20.4%
Gross Margin
82.96%
N/A
Market Cap
$23.98B
N/A
Market Cap/Employee
$6.45M
N/A
Employees
3,718
N/A
Net Income
$158.37M
+3.8%
EBITDA
$237.95M
+29.9%
Quarterly Fundamentals
Net Cash
$3.07B
-36.0%
Accounts Receivable
$495.12M
+41.1%
Inventory
$0.00
N/A
Long Term Debt
$2.83B
+16.7%
Short Term Debt
$399.74M
+2564.9%
Return on Assets
35.48%
N/A
Return on Invested Capital
88.86%
N/A
Free Cash Flow
$173.86M
-6.9%
Operating Cash Flow
$174.08M
-10.3%