Hecla Mining
(NYSE) HL
Hecla Mining Financials at a Glance
Market Cap
$10.72B
Revenue (TTM)
$1.57B
Net Income (TTM)
$273.81M
EPS (TTM)
$0.70
P/E Ratio
22.97
Dividend
$0.02
Beta (Volatility)
1.27 (Average)
Dividend
$0.02
Beta (Volatility)
1.27 (Average)
Price
$15.08
Volume
666,072
Open
$15.16
Price
$15.08
Volume
666,072
Open
$15.16
Previous Close
$15.08
Daily Range
$14.85 - $15.45
52-Week Range
$5.48 - $34.17
Estimated Earnings Date
Aug 5, 2026
Dividend
$0.02
Beta (Volatility)
1.27 (Average)
Price
$15.08
Volume
666,072
Open
$15.16
Previous Close
$15.08
Daily Range
$14.85 - $15.45
52-Week Range
$5.48 - $34.17
Estimated Earnings Date
Aug 5, 2026
HL News


Why Hecla Mining Dropped Again Today
HL: Motley Fool Moneyball Superscore
Our CEO Is Handing Members His Secret Weapon
It's called Motley Fool Moneyball, our new proprietary AI tool
We spent over half a million dollars in R&D to build a tool that makes stock research faster, sharper, and smarter. Our analysts use it every day, and now, you can too.
Get Access NowAbout Hecla Mining
Industry
Metals and Mining
Sector
MaterialsEmployees
1,865
CEO
Robert L. Krcmarov
Website
www.hecla.comHeadquarters
Coeur d'Alene, ID 83815-9408, US
HL Financials
Key Financial Metrics (TTM)
Gross Margin
50.95%
Operating Margin
44.39%
Net Income Margin
17.41%
Return on Equity
11.04%
Return on Capital
18.72%
Return on Assets
8.11%
Earnings Yield
4.35%
Dividend Yield
0.09%
Payout Ratio
3.89%
Stock Overview
Market Cap
$10.72B
Shares Outstanding
670.71M
Volume
666.07K
Avg. Volume
16.49M
Financials (TTM)
Gross Profit
$801.45M
Operating Income
$698.33M
EBITDA
$845.51M
Operating Cash Flow
$721.15M
Capital Expenditure
-$253.82M
Free Cash Flow
$467.33M
Cash & ST Invst.
$607.12M
Total Debt
$266.25M
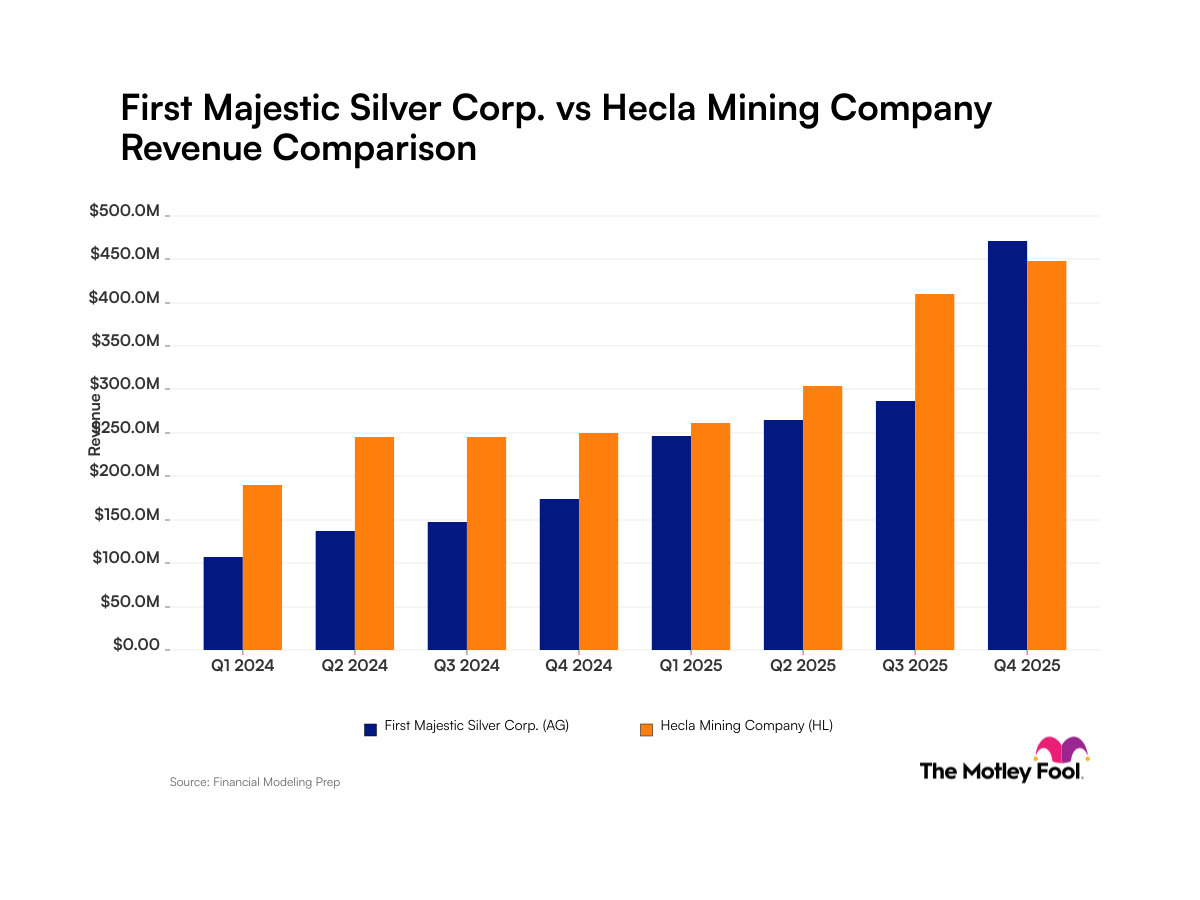
Hecla Mining Performance Analysis
Revenue Growth Rate
Annual and quarterly growth comparisonEarnings Per Share Growth Rate
Annual and quarterly EPS growth comparisonQuarterly Performance
Revenue
$411.43M
+57.4%
Gross Profit
$253.26M
+242.2%
Gross Margin
61.55%
N/A
Market Cap
$10.72B
N/A
Market Cap/Employee
$5.86M
N/A
Employees
1,830
N/A
Net Income
-$19.03M
-165.9%
EBITDA
$255.68M
+167.1%
Quarterly Fundamentals
Total Cash
$607.12M
+2465.1%
Total Debt
$266.25M
-53.2%
Accounts Receivable
$242.15M
+202.4%
Inventory
$80.34M
-31.6%
Long Term Debt
$262.65M
-50.2%
Short Term Debt
$3.60M
-91.3%
Return on Assets
8.11%
N/A
Return on Invested Capital
21.94%
N/A
Free Cash Flow
$154.98M
+944.3%
Operating Cash Flow
$194.25M
+443.5%