Accessibility Menu
Lithium Americas logo

Lithium Americas(NYSE) LAC

Market Cap$996.95MMarket cap calculated using publicly traded shares outstanding only. Does not include unlisted, private, or dual-class non-traded shares. Implied market cap may vary.
Since IPO (2023)-72%
5 YearN/A
1 Year+12%
1 Month-25%
$2.87
-0.87%
-0.02Today
After hours$2.86-$0.01 (-0.18%)
Lithium Americas last closing stock price
MetricPriceDate
Last closeUSD 2.872026-07-31
Lithium Americas stock price return by period
PeriodPrice returnPrice at period startPeriod start date
1 week+2.14%USD 2.812026-07-24
1 month-25.07%USD 3.832026-07-01
3 month-49.74%USD 5.712026-05-01
Year to date-34.17%USD 4.362025-12-31
1 year+11.67%USD 2.572025-07-31
Since inception-71.67%USD 10.132023-10-02

Lithium Americas Financials at a Glance

Market Cap

$996.95MMarket cap calculated using publicly traded shares outstanding only. Does not include unlisted, private, or dual-class non-traded shares. Implied market cap may vary.

Revenue (TTM)

$0.00

Net Income (TTM)

-$111.79M

EPS (TTM)

-$0.57

P/E Ratio

-5.02

Dividend

$0.00

Beta (Volatility)

1.74 (High)

Price

$2.87

Volume

4,895,678

Open

$2.90

Previous Close

$2.87

Daily Range

$2.81 - $2.93

52-Week Range

$2.53 - $10.52

Estimated Earnings Date

Aug 13, 2026

LAC: Motley Fool Moneyball Superscore

59

Our CEO Is Handing Members His Secret Weapon

It's called Motley Fool Moneyball, our new proprietary AI tool

We spent over half a million dollars in R&D to build a tool that makes stock research faster, sharper, and smarter. Our analysts use it every day, and now, you can too.

Get Access Now

About Lithium Americas

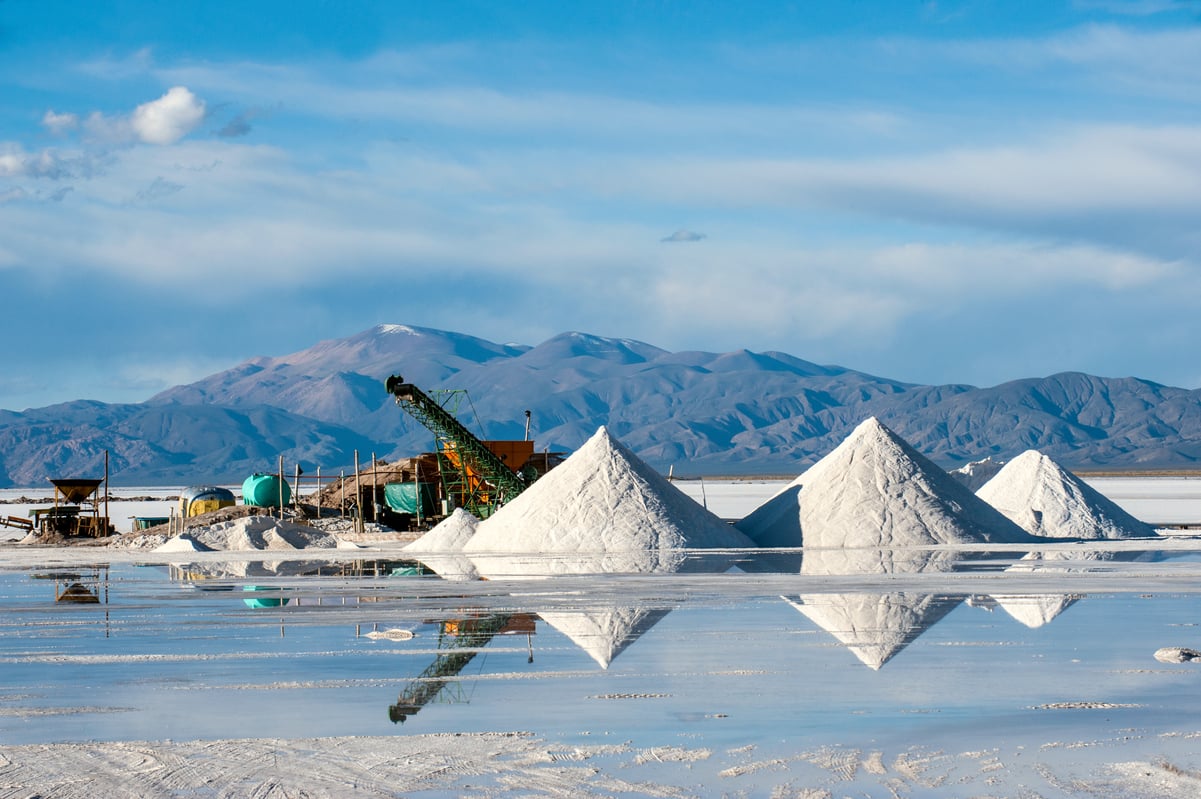
Lithium Americas digs up lithium for electric car batteries. It builds plants to turn raw dirt into battery chemicals. These chemicals help car companies build power for electric travel.

What's in the Mine?

  • Lithium Carbonate: High-purity chemical used to make batteries for electric vehicles; planned as the primary product for the Nevada facility.
  • Sedimentary Clay: Large lithium-rich soil deposits found at the Thacker Pass site; extracted through a specialized acid process.
  • Technical Research: Pilot plant testing to turn raw ore into battery-grade materials; uses a Reno-based center for quality control.

Strategic Deals and Funding

  • Separated from Lithium Argentina in October 2023 to focus on developing North American lithium assets.
  • Formed a joint venture with General Motors in December 2024 to fund and operate the Thacker Pass site.
  • Secured a $2.26 billion loan from the U.S. Department of Energy in October 2024 for construction costs.
  • Closed a $250 million strategic investment from Orion Resource Partners in April 2025 to support project development.

A Unique Domestic Resource

Lithium Americas manages the Thacker Pass project, which is the largest known lithium resource in the United States. The company uses a specific process to pull lithium from clay deposits to create battery-grade chemicals for domestic car manufacturing.

The Financial Record

  • Net income reached $100.3 million in Q4 2025, turning positive from a $20.7 million loss in Q4 2024.
  • Operating income reached -$29.2 million in Q4 2025, deepening the loss by 202.8% year-over-year.
  • Gross profit reached -$247,750 in Q4 2025, narrowing the loss by 78.9% compared to the previous year.
  • Free cash flow reached -$264.6 million in Q4 2025, deepening the deficit by 253% from Q4 2024.

The Long View

Lithium Americas has evolved from a small explorer into a construction-focused developer with significant backing from the government and auto industry. Its growth centers on creating a stable, domestic source of lithium for the electric vehicle market.

AI Generated • Apr 29, 2026

Industry

Metals and Mining

Sector

Materials

Employees

94

CEO

Jonathan D. Evans, MBA

Headquarters

Vancouver, BC V6C 1E5, CA

LAC Financials

Key Financial Metrics (TTM)

Gross Margin

0.00%

Operating Margin

0.00%

Net Income Margin

0.00%

Return on Equity

-12.78%

Return on Capital

-3.32%

Return on Assets

-3.58%

Earnings Yield

-19.92%

Dividend Yield

0.00%

Payout Ratio

0.00%

Stock Overview

Market Cap

$996.95MMarket cap calculated using publicly traded shares outstanding only. Does not include unlisted, private, or dual-class non-traded shares. Implied market cap may vary.

Shares Outstanding

347.37M

Volume

4.90M

Avg. Volume

10.79M

Financials (TTM)

Gross Profit

-$10.00K

Operating Income

-$57.40M

EBITDA

-$51.30M

Operating Cash Flow

-$61.19M

Capital Expenditure

-$952.56M

Free Cash Flow

-$1.01B

Cash & ST Invst.

$1.21B

Total Debt

$877.77M

Lithium Americas Performance Analysis

Lithium Americas annual revenue and year-over-year revenue growth by fiscal year
Fiscal yearPeriod endRevenueYoY growth
20222022-12-31USD 0N/A
20232023-12-31USD 0N/A
20242024-12-31USD 0N/A
20252025-12-31USD 0N/A
Lithium Americas sequential (quarter-over-quarter) revenue growth by fiscal quarter
Fiscal quarterPeriod endQoQ growth
Q22025-06-30N/A
Q32025-09-30N/A
Q42025-12-31N/A
Q12026-03-31N/A
Lithium Americas annual diluted earnings per share and year-over-year EPS growth by fiscal year
Fiscal yearPeriod endDiluted EPSYoY growth
20222022-12-31USD -0.4243.8%
20232023-12-31USD -0.03-92.5%
20242024-12-31USD -0.21568.1%
20252025-12-31USD -0.50136.6%
Lithium Americas sequential (quarter-over-quarter) diluted earnings per share growth by fiscal quarter
Fiscal quarterPeriod endQoQ growth
Q22025-06-30-15.7%
Q32025-09-30-1363.8%
Q42025-12-31151.8%
Q12026-03-31-100.4%

Revenue Growth Rate

Annual and quarterly growth comparison

Currently no data to display.

Earnings Per Share Growth Rate

Annual and quarterly EPS growth comparison

Quarterly Performance

Name
Q1 2026YOY CHG

Revenue

$0.00

N/A

Gross Profit

$0.00

+100.0%

Gross Margin

0.00%

N/A

Market Cap

$996.95MMarket cap calculated using publicly traded shares outstanding only. Does not include unlisted, private, or dual-class non-traded shares. Implied market cap may vary.

N/A

Market Cap/Employee

$10.61M

N/A

Employees

94

N/A

Net Income

-$409.00K

+96.2%

EBITDA

-$10.77M

+4.4%

Quarterly Fundamentals

Name
Q1 2026YOY CHG

Total Cash

$1.21B

+171.3%

Total Debt

$877.77M

+4041.6%

Accounts Receivable

$3.14M

+405.7%

Inventory

$0.00

N/A

Long Term Debt

$871.97M

+5542.0%

Short Term Debt

$5.81M

+1.2%

Return on Assets

-3.58%

N/A

Return on Invested Capital

-1.94%

N/A

Free Cash Flow

-$313.18M

-129.0%

Operating Cash Flow

-$18.00M

+4.5%

Other Investments to Explore

People Also Watch

Symbol / CompanyPricePrice Chg
LARLithium Argentina AG
$6.01+1.35%
IPXIperionX Limited
$20.75-3.67%
LOMALoma Negra Compañía Industrial Argentina Sociedad Anónima
$11.48-3.12%
GSMFerroglobe PLC
$3.18-0.93%

Trending Stocks

Symbol / CompanyPricePrice Chg
NVDANvidia
$200.75+0.03%
AAPLApple
$308.91-0.07%
AMZNAmazon
$271.58+0.15%
INTCIntel
$90.20-0.01%

Questions About LAC

What is the current price of Lithium Americas?

Lithium Americas is trading at $2.87 per share.

What is the 52-week range for Lithium Americas?

Over the past 52 weeks, Lithium Americas has traded between $2.53 and $10.52.

How much debt does Lithium Americas have?

As of the most recent reporting period, Lithium Americas reported total debt of $874.90M.

How much cash does Lithium Americas have on hand?

Lithium Americas reported $1.21B in cash and cash equivalents in its most recent financial results.

What is Lithium Americas’s dividend yield?

Lithium Americas does not currently have a dividend yield.

Premium Investing Services

Invest better with The Motley Fool. Get stock recommendations, portfolio guidance, and more from The Motley Fool's premium services.