Vistra
(NYSE) VST
Vistra Financials at a Glance
Market Cap
$51.82B
Revenue (TTM)
$16.21B
Net Income (TTM)
$2.24B
EPS (TTM)
$5.99
P/E Ratio
25.67
Dividend
$0.91
Beta (Volatility)
1.29 (Average)
Dividend
$0.91
Beta (Volatility)
1.29 (Average)
Price
$148.70
Volume
124,920
Open
$151.85
Price
$148.70
Volume
124,920
Open
$151.85
Previous Close
$148.70
Daily Range
$147.50 - $154.20
52-Week Range
$132.66 - $219.82
Estimated Earnings Date
Aug 6, 2026
Dividend
$0.91
Beta (Volatility)
1.29 (Average)
Price
$148.70
Volume
124,920
Open
$151.85
Previous Close
$148.70
Daily Range
$147.50 - $154.20
52-Week Range
$132.66 - $219.82
Estimated Earnings Date
Aug 6, 2026
VST News


VST: Motley Fool Moneyball Superscore
Our CEO Is Handing Members His Secret Weapon
It's called Motley Fool Moneyball, our new proprietary AI tool
We spent over half a million dollars in R&D to build a tool that makes stock research faster, sharper, and smarter. Our analysts use it every day, and now, you can too.
Get Access NowAbout Vistra
Industry
Independent Power and Renewable Electricity Producers
Sector
UtilitiesEmployees
6,390
CEO
James A. Burke, CFA, MBA
Website
vistracorp.comHeadquarters
Irving, TX 75039, US
VST Financials
Key Financial Metrics (TTM)
Gross Margin
13%
Operating Margin
2%
Net Income Margin
14%
Return on Equity
43%
Return on Capital
1%
Return on Assets
5%
Earnings Yield
3.90%
Dividend Yield
0.59%
Payout Ratio
21.95%
Stock Overview
Market Cap
$51.82B
Shares Outstanding
337.18M
Volume
124.92K
Avg. Volume
4.64M
Financials (TTM)
Gross Profit
$2.97B
Operating Income
$1.34B
EBITDA
$5.25B
Operating Cash Flow
$4.07B
Capital Expenditure
-$3.94B
Free Cash Flow
$129.00M
Cash & ST Invst.
$816.00M
Total Debt
$20.40B
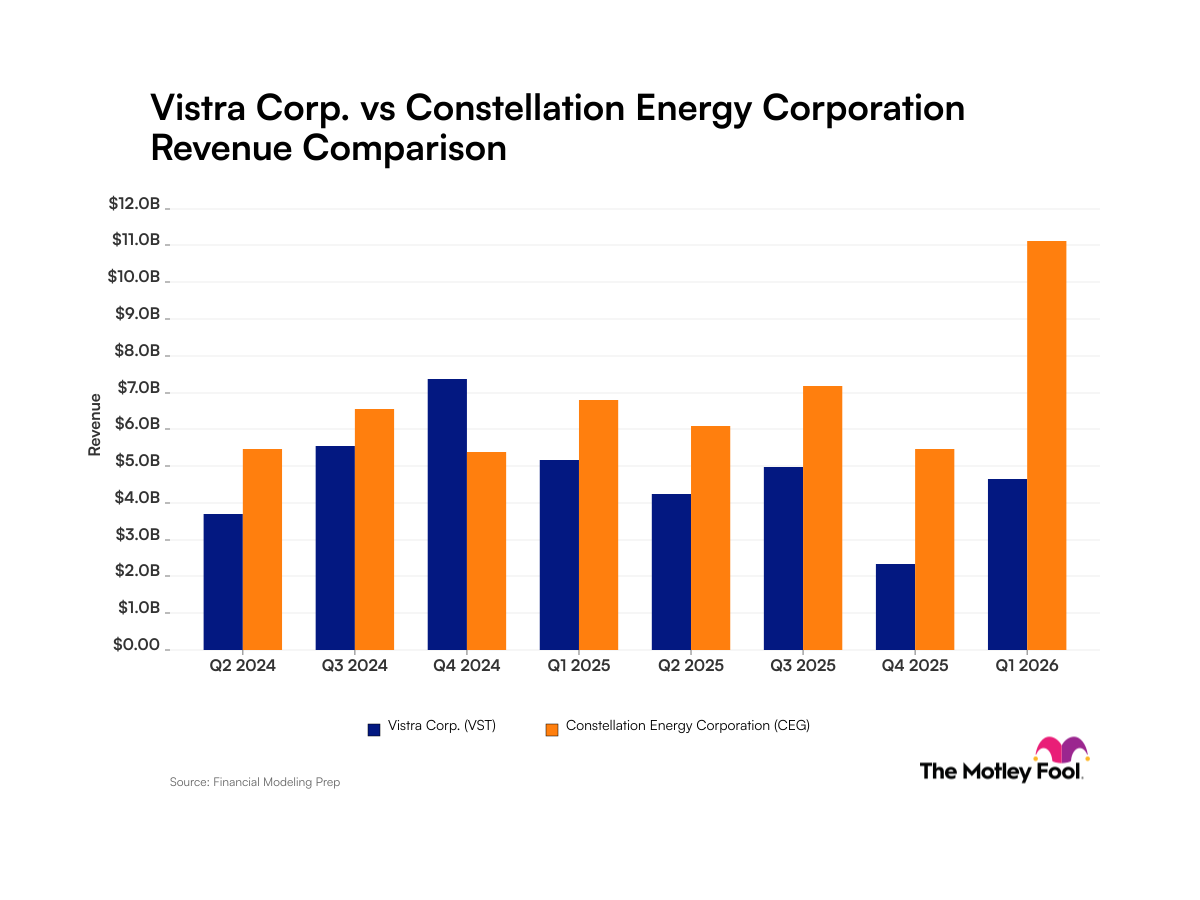
Vistra Performance Analysis
Revenue Growth Rate
Annual and quarterly growth comparisonEarnings Per Share Growth Rate
Annual and quarterly EPS growth comparisonQuarterly Performance
Revenue
$4.65B
-10.0%
Gross Profit
$943.00M
-38.8%
Gross Margin
20.26%
N/A
Market Cap
$51.82B
N/A
Market Cap/Employee
$7.57M
N/A
Employees
6,850
N/A
Net Income
$1.03B
+484.0%
EBITDA
$1.25B
+107.8%
Quarterly Fundamentals
Net Cash
-$19.24B
-12.4%
Accounts Receivable
$1.98B
+3.1%
Inventory
$1.03B
+7.3%
Long Term Debt
$17.26B
+9.8%
Short Term Debt
$2.65B
+34.9%
Return on Assets
5.43%
N/A
Return on Invested Capital
1.08%
N/A
Free Cash Flow
$156.00M
+192.3%
Operating Cash Flow
$1.20B
+100.2%