Accessibility Menu
Vulcan Materials logo

Vulcan Materials(NYSE) VMC

Market Cap$35.77BMarket cap calculated using publicly traded shares outstanding only. Does not include unlisted, private, or dual-class non-traded shares. Implied market cap may vary.
Since IPO (1968)+143,113%
5 Year+57%
1 Year-4%
1 Month-0%
Premium Feature
Moneyball Superscore
72/100
$275.77
+1.88%
+5.10Today
After hours$276.05+$0.28 (+0.10%)
Vulcan Materials last closing stock price
MetricPriceDate
Last closeUSD 276.042026-08-21
Vulcan Materials stock price return by period
PeriodPrice returnPrice at period startPeriod start date
1 week-2.11%USD 282.002026-08-14
1 month-0.46%USD 277.312026-07-22
3 month+6.1%USD 260.172026-05-22
Year to date-2.66%USD 283.592025-12-31
1 year-3.53%USD 286.142025-08-21
3 year+31.54%USD 209.852023-08-22
5 year+56.63%USD 176.242021-08-20
Since inception+143,112.93%USD 0.191968-01-02

Vulcan Materials Financials at a Glance

Market Cap

$35.77BMarket cap calculated using publicly traded shares outstanding only. Does not include unlisted, private, or dual-class non-traded shares. Implied market cap may vary.

Revenue (TTM)

$8.11B

Net Income (TTM)

$1.12B

EPS (TTM)

$8.47

P/E Ratio

32.58

Dividend

$2.05

Beta (Volatility)

0.93 (Low)

Price

$275.77

Volume

903,343.073

Open

$272.83

Previous Close

$276.04

Daily Range

$270.96 - $277.80

52-Week Range

$252.35 - $331.09

Estimated Earnings Date

Oct 29, 2026

VMC: Motley Fool Moneyball Superscore

72

Our CEO Is Handing Members His Secret Weapon

It's called Motley Fool Moneyball, our new proprietary AI tool

We spent over half a million dollars in R&D to build a tool that makes stock research faster, sharper, and smarter. Our analysts use it every day, and now, you can too.

Get Access Now

About Vulcan Materials

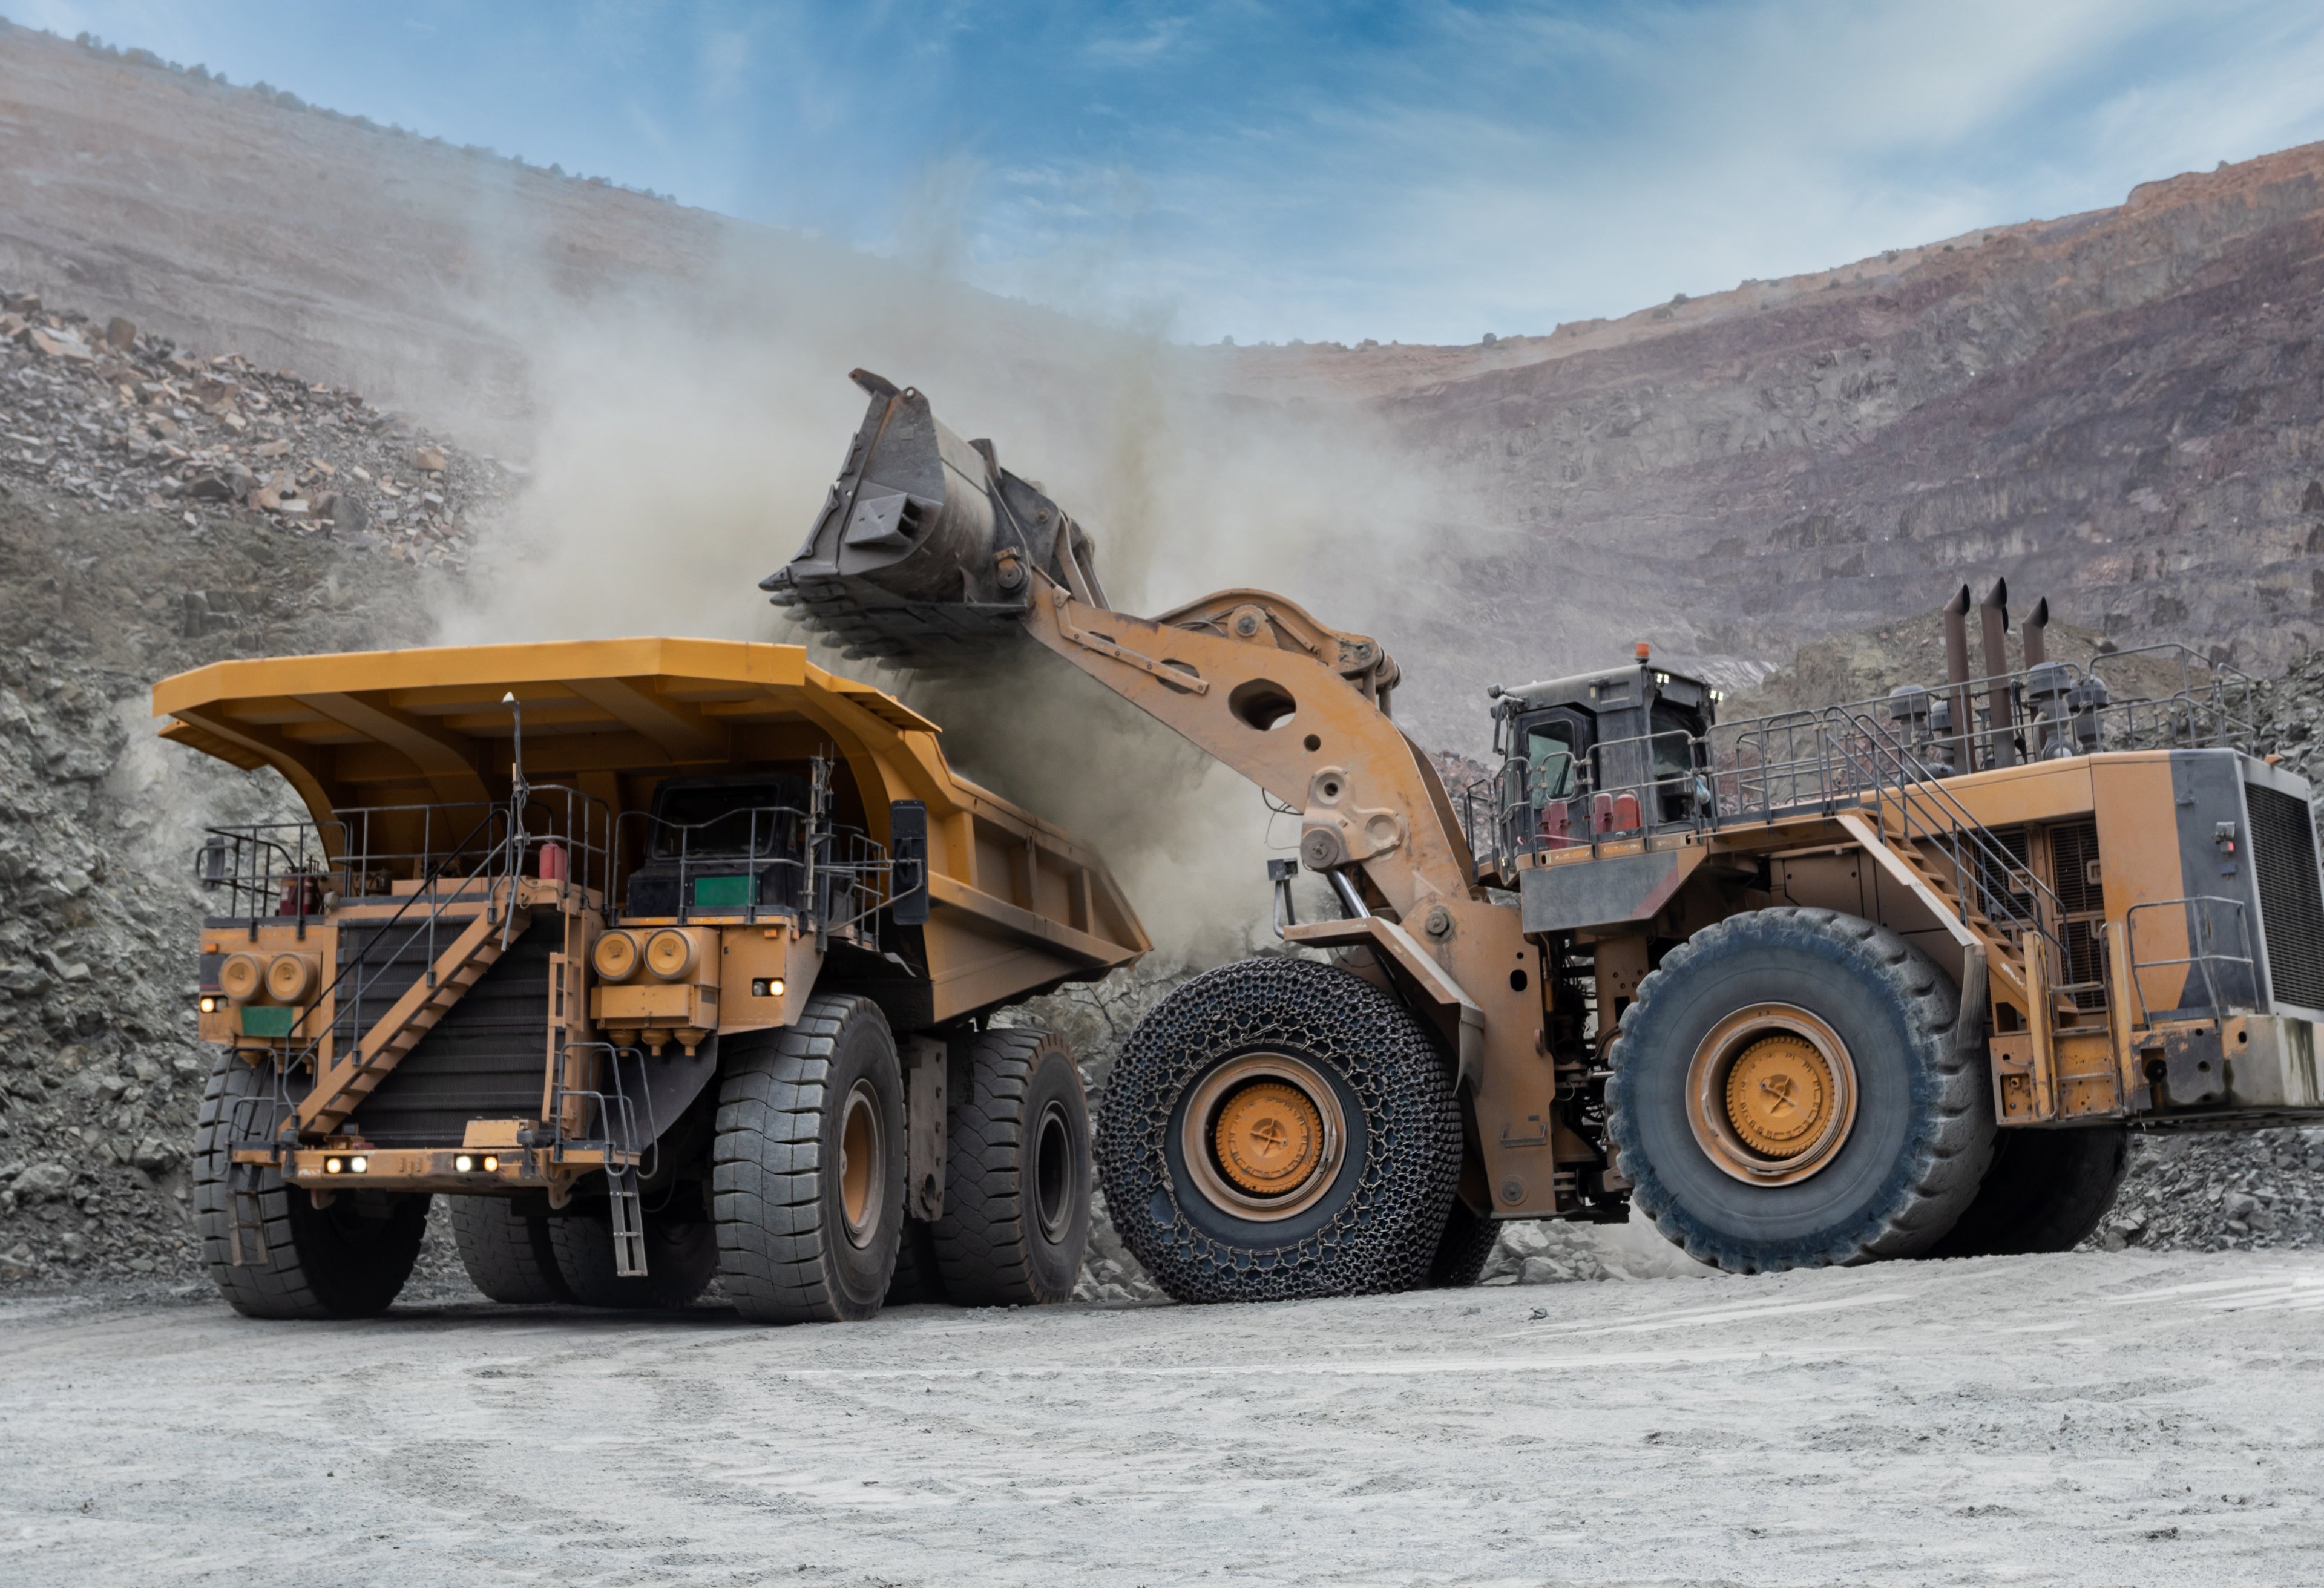
Vulcan Materials Company provides stone and gravel for building roads. It helps construction crews get heavy materials for infrastructure projects. These products create foundations for homes and public buildings.

Rock, Sand, and Gravel

  • Aggregates: Crushed stone, sand, and gravel for construction; segment sales were $1.8 billion in the second quarter of 2026.
  • Asphalt Mix: Road-building material made of 95% aggregates; used in six U.S. states including California and Texas.
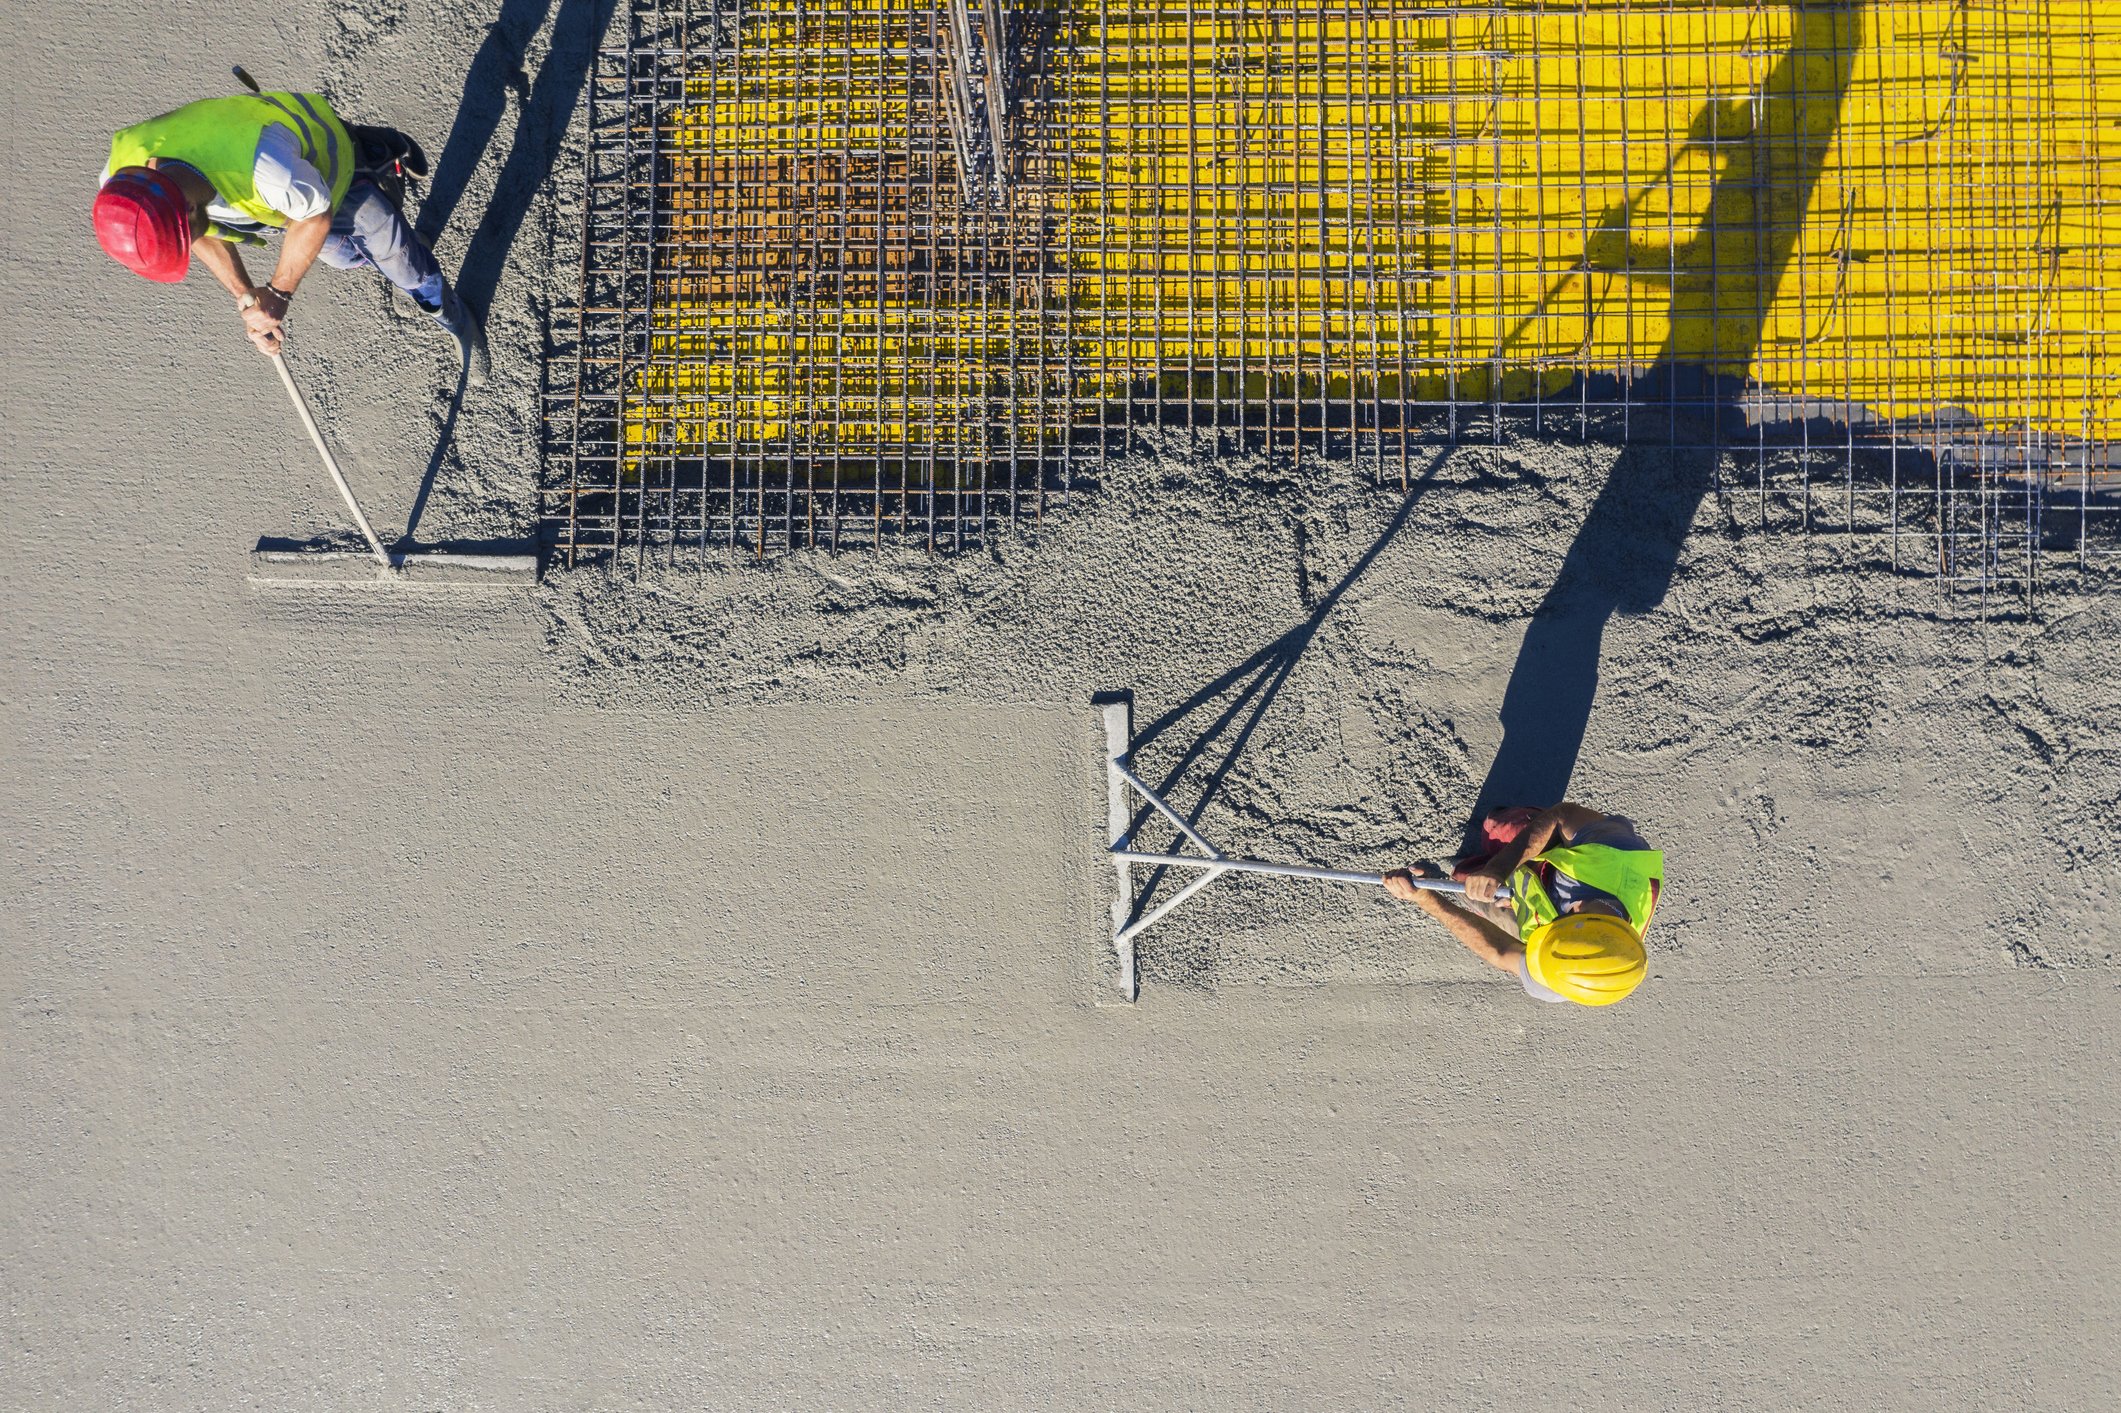
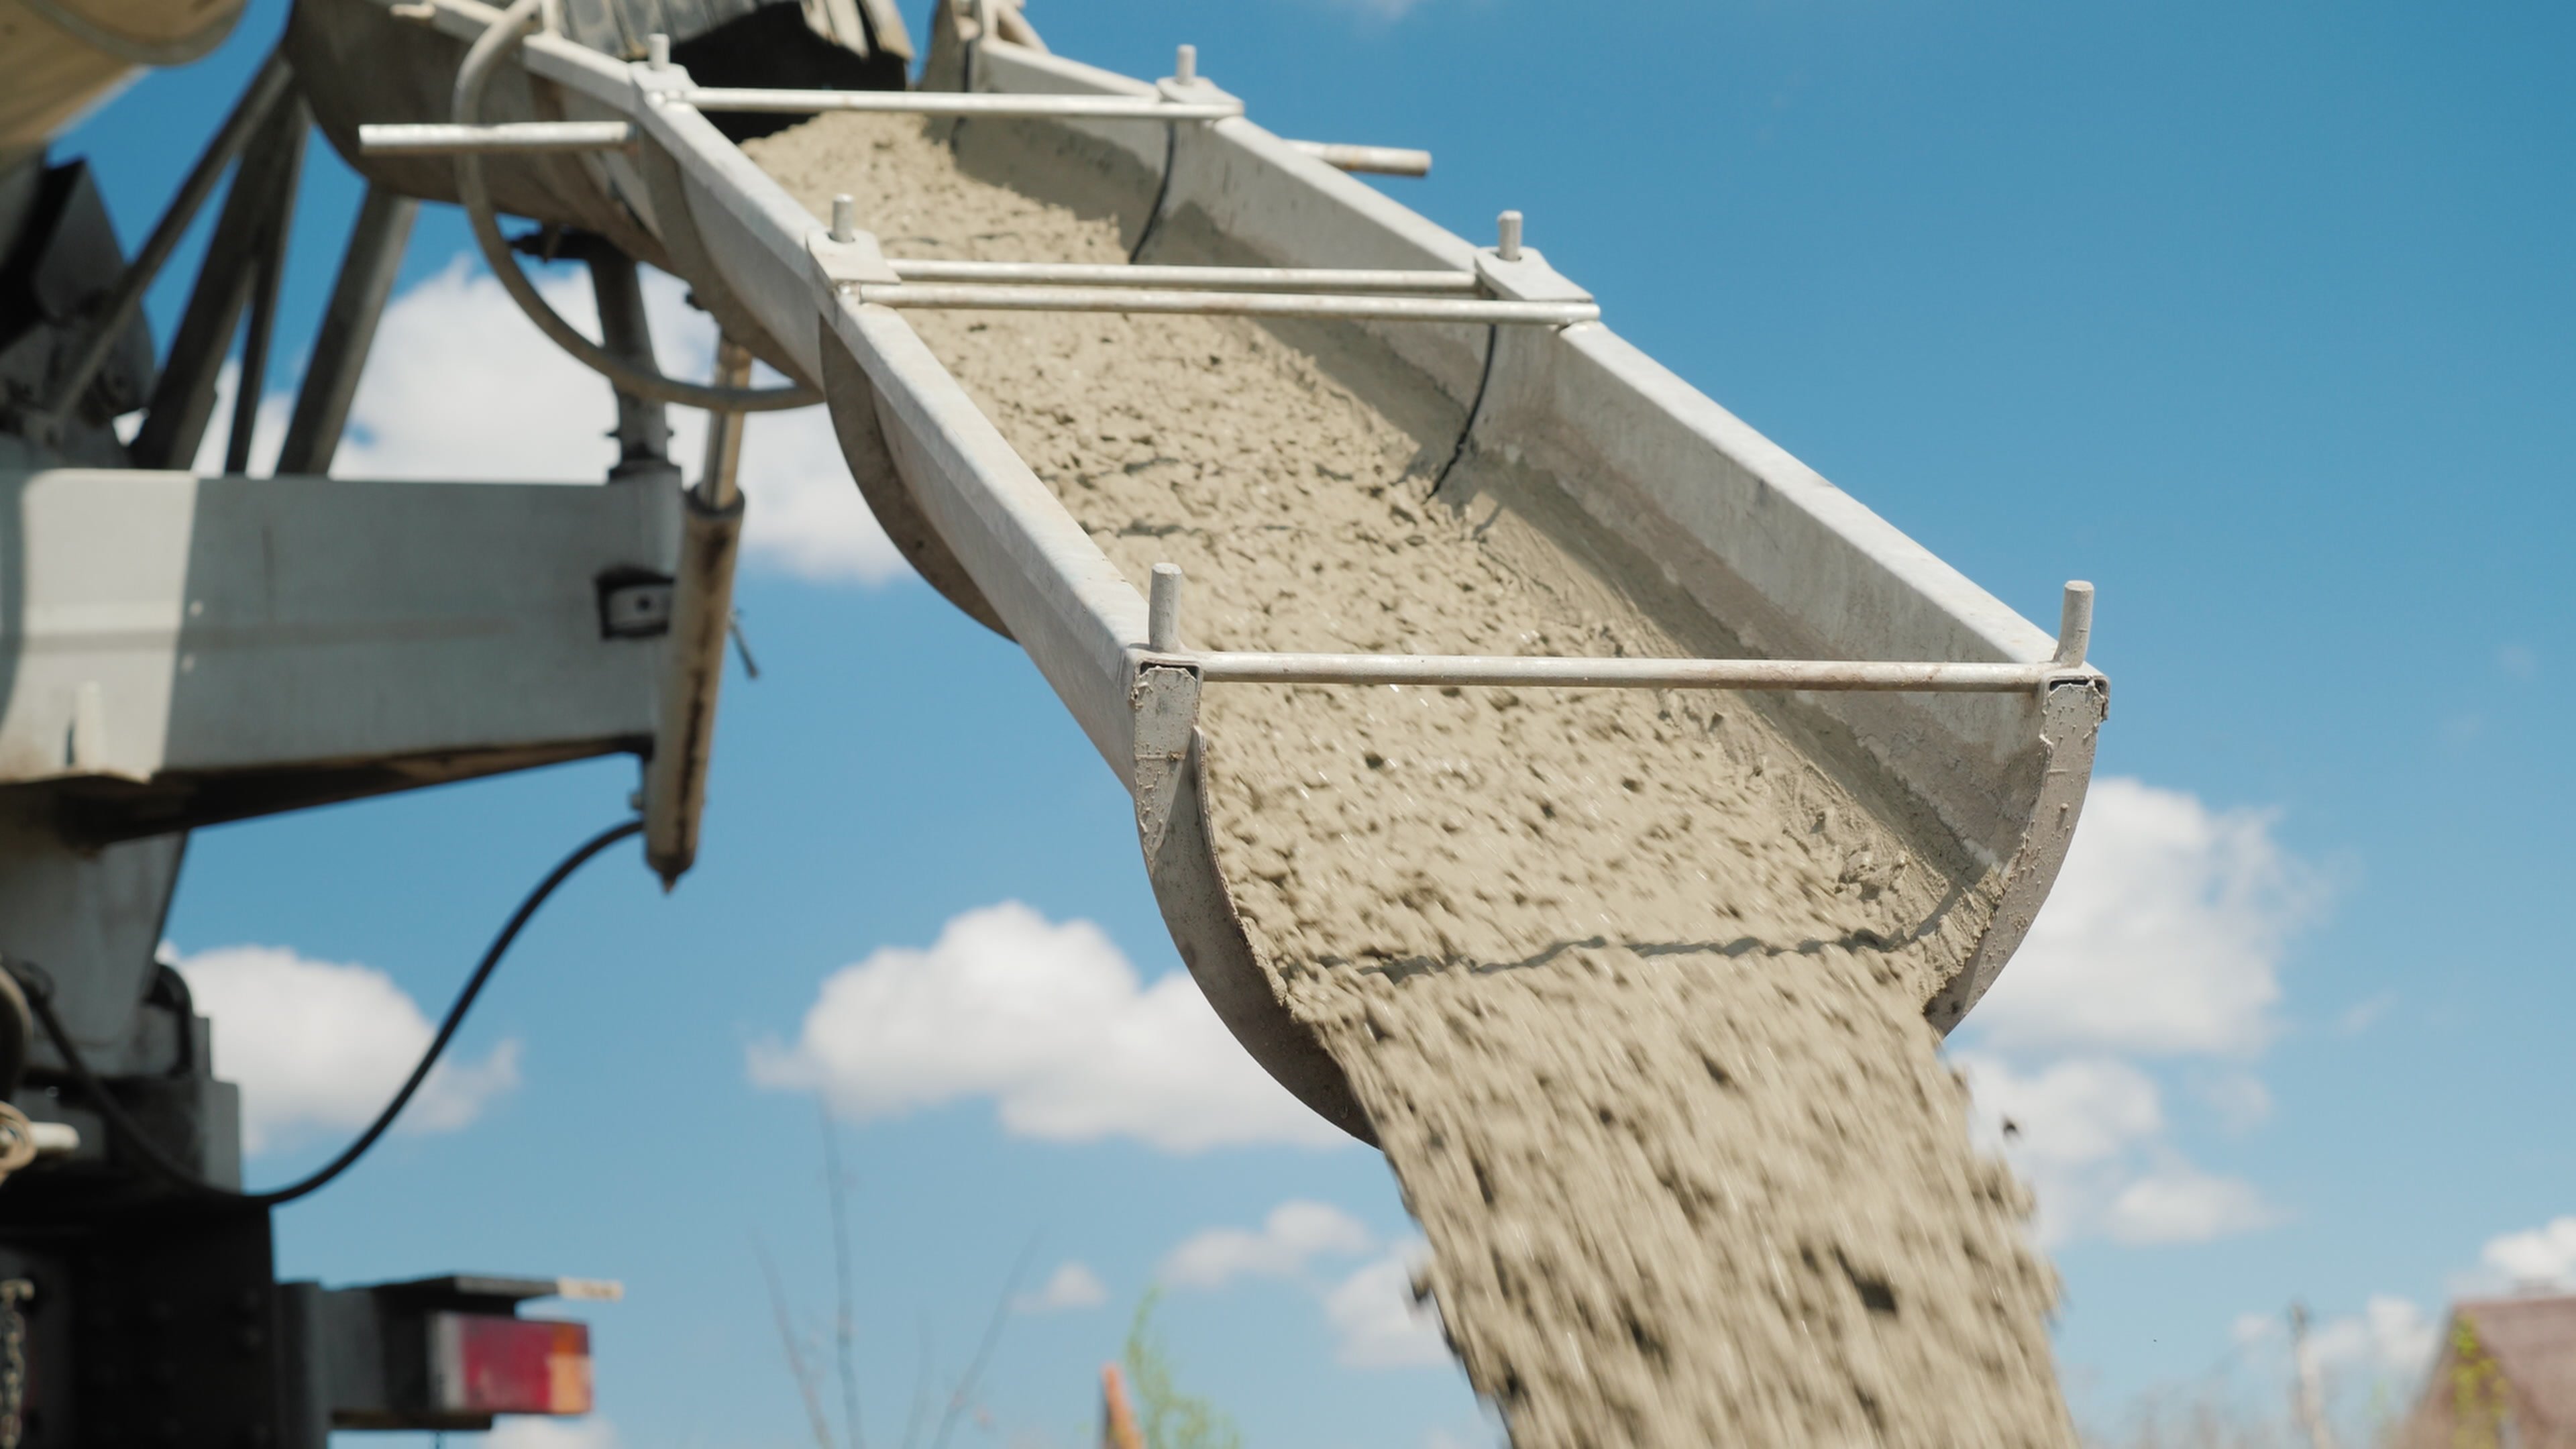
  • Ready-Mixed Concrete: Heavy building material composed of 80% aggregates; used for sidewalks, buildings, and other structures.
  • Calcium: Mined products used in animal feed, plastics, and water treatment applications.

Reshaping the Portfolio

  • Completed the sale of ready-mixed concrete operations in California in June 2026.
  • Acquired a quarry in southern Colorado and a rail yard in the Dallas-Fort Worth area during the second quarter of 2026.
  • Sold aggregates and concrete operations in the U.S. Virgin Islands during the first half of 2026.
  • Divested the Houston asphalt and construction business in the fourth quarter of 2025.

Supply Chains and Vertical Integration

The company operates a fleet of Panamax-class ships, which are large vessels built to fit through the Panama Canal, to transport materials to coastal markets. It uses its own stone and gravel to produce downstream asphalt and concrete in a process known as vertical integration.

Second Quarter Performance

  • Total revenues increased 3% to $2.2 billion in the second quarter of 2026.
  • Aggregates segment sales rose 7% to $1.8 billion during the second quarter of 2026.
  • Net earnings reached $323.4 million in the second quarter of 2026, up 1% year over year.
  • Return on invested capital, a measure of how effectively a company uses its money, was 16.1% for the trailing-twelve months ended June 30, 2026.

Company Evolution

Vulcan Materials Company has transitioned to a strategy centered on its core aggregates business while selling off various concrete and asphalt assets. This shift prioritizes high-margin mining operations and a disciplined geographic footprint in the United States.

AI Generated • Aug 4, 2026

Industry

Construction Materials

Sector

Materials

Employees

11,548

CEO

Ronnie A. Pruitt

Headquarters

Birmingham, AL 35242, US

VMC Financials

Key Financial Metrics (TTM)

Gross Margin

27.43%

Operating Margin

19.92%

Net Income Margin

13.82%

Return on Equity

13.11%

Return on Capital

11.42%

Return on Assets

6.81%

Earnings Yield

3.07%

Dividend Yield

0.74%

Payout Ratio

23.61%

Stock Overview

Market Cap

$35.77BMarket cap calculated using publicly traded shares outstanding only. Does not include unlisted, private, or dual-class non-traded shares. Implied market cap may vary.

Shares Outstanding

129.58M

Volume

903.34K

Avg. Volume

1.14M

Financials (TTM)

Gross Profit

$2.22B

Operating Income

$1.62B

EBITDA

$2.56B

Operating Cash Flow

$1.80B

Capital Expenditure

-$777.20M

Free Cash Flow

$1.03B

Cash & ST Invst.

$194.20M

Total Debt

$4.89B

Vulcan Materials Performance Analysis

Vulcan Materials annual revenue and year-over-year revenue growth by fiscal year
Fiscal yearPeriod endRevenueYoY growth
20222022-12-31USD 7,315,200,00031.8%
20232023-12-31USD 7,781,900,0006.4%
20242024-12-31USD 7,417,700,000-4.7%
20252025-12-31USD 7,941,100,0007.1%
Vulcan Materials sequential (quarter-over-quarter) revenue growth by fiscal quarter
Fiscal quarterPeriod endQoQ growth
Q32025-09-308.6%
Q42025-12-31-16.2%
Q12026-03-31-8.2%
Q22026-06-3022.8%
Vulcan Materials annual diluted earnings per share and year-over-year EPS growth by fiscal year
Fiscal yearPeriod endDiluted EPSYoY growth
20222022-12-31USD 4.31-14.3%
20232023-12-31USD 6.9862.0%
20242024-12-31USD 6.85-1.8%
20252025-12-31USD 8.1118.4%
Vulcan Materials sequential (quarter-over-quarter) diluted earnings per share growth by fiscal quarter
Fiscal quarterPeriod endQoQ growth
Q32025-09-3017.4%
Q42025-12-31-32.5%
Q12026-03-31-34.0%
Q22026-06-3096.8%

Revenue Growth Rate

Annual and quarterly growth comparison

Earnings Per Share Growth Rate

Annual and quarterly EPS growth comparison

Quarterly Performance

Name
Q2 2026YOY CHG

Revenue

$2.16B

+2.5%

Gross Profit

$625.50M

+0.0%

Gross Margin

29.01%

N/A

Market Cap

$35.77BMarket cap calculated using publicly traded shares outstanding only. Does not include unlisted, private, or dual-class non-traded shares. Implied market cap may vary.

N/A

Market Cap/Employee

$3.10M

N/A

Employees

11,548

N/A

Net Income

$323.40M

+0.8%

EBITDA

$625.00M

-5.1%

Quarterly Fundamentals

Name
Q2 2026YOY CHG

Total Cash

$194.20M

-44.1%

Total Debt

$4.89B

-10.3%

Accounts Receivable

$1.11B

+3.0%

Inventory

$688.70M

-5.1%

Long Term Debt

$4.49B

-8.4%

Short Term Debt

$400.00M

-27.3%

Return on Assets

6.81%

N/A

Return on Invested Capital

10.62%

N/A

Free Cash Flow

$149.60M

-37.4%

Operating Cash Flow

$343.50M

+0.5%

Other Investments to Explore

People Also Watch

Symbol / CompanyPricePrice Chg
MLMMartin Marietta Materials, Inc.
$534.92+1.84%
GFIGold Fields Limited
$47.81+5.19%
AMRZAmrize Ltd
$45.68+2.38%
FNVFranco-Nevada Corporation
$265.74+2.94%

Trending Stocks

Symbol / CompanyPricePrice Chg
TSLLDirexion Shares ETF Trust - Direxion Daily Tsla Bull 2x ETF
$9.77+0.10%
IBITiShares Bitcoin Trust
$43.68+0.06%
BITOProShares Trust - ProShares Bitcoin ETF
$10.41+0.06%
MARAMara Holdings
$11.26+0.01%

Questions About VMC

What is the current price of Vulcan Materials?

Vulcan Materials is trading at $276.04 per share.

What is the 52-week range for Vulcan Materials?

Over the past 52 weeks, Vulcan Materials has traded between $252.35 and $331.09.

How much debt does Vulcan Materials have?

As of the most recent reporting period, Vulcan Materials reported total debt of $4.94B.

How much cash does Vulcan Materials have on hand?

Vulcan Materials reported $288.70M in cash and cash equivalents in its most recent financial results.

What is Vulcan Materials’s dividend yield?

Vulcan Materials currently has a dividend yield of 0.74%.

Premium Investing Services

Invest better with The Motley Fool. Get stock recommendations, portfolio guidance, and more from The Motley Fool's premium services.