The Vanguard S&P 500 ETF (VOO 0.23%) and the iShares Russell 2000 ETF (IWM 1.41%) track very different market segments. While the Vanguard S&P 500 ETF targets the largest 500 U.S. companies, the iShares Russell 2000 ETF covers nearly 2,000 small-cap names.
Here's how the two ETFs compare in terms of costs, returns, risk, and portfolio makeup.

Image source: Getty Images.
Snapshot (cost & size)
| Metric | IWM | VOO |
|---|---|---|
| Issuer | IShares | Vanguard |
| Expense ratio | 0.19% | 0.03% |
| 1-yr return (as of Oct. 27, 2025) | 12.5% | 18.0% |
| Dividend yield | 1.2% | 1.1% |
| Beta | 1.30 | NA |
| AUM | $70.8 billion | $1.4 trillion |
Beta measures price volatility relative to the S&P 500; figures use five-year weekly returns.
VOO is significantly more affordable on fees, charging just 0.03% compared to IWM’s 0.19%. The dividend yield is quite similar for both ETFs, with IWM offering a slightly higher payout for investors seeking income.
Performance & risk comparison
| Metric | IWM | VOO |
|---|---|---|
| Max drawdown (5 y) | -31.91% | -24.53% |
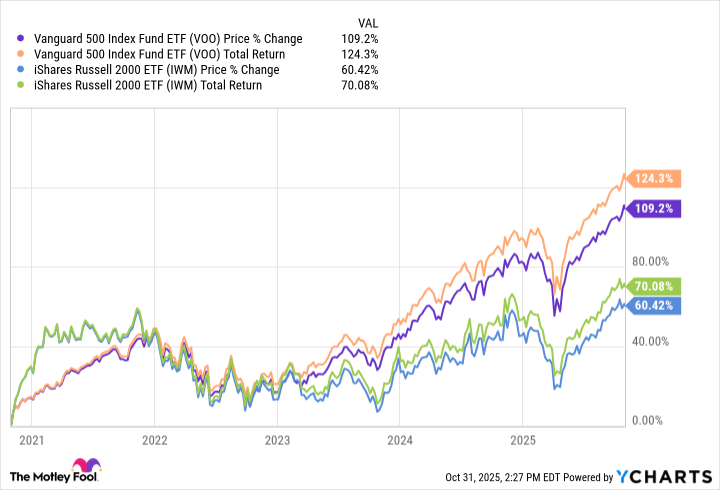
| Growth of $1,000 over 5 years (as of 10/27/2025) | $1,569 | $2,021 |
What's inside
VOO tracks the S&P 500, providing exposure to mega- and large-cap U.S. stocks. Technology dominates the portfolio at 35%, followed by financial services and consumer discretionary sectors. The fund holds 504 stocks, with top allocations to NVIDIA (NVDA 1.87%), Microsoft (MSFT 0.79%), and Apple (AAPL +1.46%). It has no notable structural quirks and has been operating for 15.1 years.
By contrast, IWM focuses on U.S. small-cap stocks, with notable weights in industrials (nearly 18%), financial services (17%), and healthcare and industrials (roughly 16% each). The fund is highly diversified across 1,966 holdings, with very small individual allocations. Its top names, such as Bloom Energy (BE +2.40%), Credo Technology Group Holding (CRDO 3.24%), Fabrinet (FN 1.37%), and Ionq (IONQ +0.38%)each represent less than 1% of assets.
For more guidance on ETF investing, check out the full guide at this link.
Foolish take
Investors can buy shares of ETFs just like they would buy shares of an individual company. With ETFs, though, investors can gain exposure to many companies with just one stock. So, by buying just one stock of the Vanguard S&P 500 ETF, you can invest in all 500 companies in the S&P 500 index. Likewise, by buying just one stock of the iShares Russell 2000 ETF, you can invest in all 2,000 companies from the Rusell 2000 Index.
What ETF you choose depends on the investment objective and cost. IWM’s focus on small-cap stocks makes it relatively riskier than VOO, simply because small-cap companies are often young and yet to establish themselves, which also makes their stock prices more volatile. Large-cap stocks, like the one VOO invests in, are often stalwarts in their respective industries with established revenue and profit streams that also make their stock prices less volatile in the long run.
VOO’s notably low expense ratio can also make a huge difference to your total returns on investment in the long term. Evidence lies in the numbers – VOO has significantly outperformed IWM, whether you go back one, three, five, or ten years.
That’s not to say you should write off IWM. Small-caps stocks can offer tremendous growth potential, so this ETF will appeal to investors who are willing to take more risks and bet on young companies that could be tomorrow’s giants. A risk-averse investor seeking more stable gains will, instead, buy shares in VOO.TMF Writers add your take here...
Glossary
ETF: Exchange-traded fund; a basket of securities traded on an exchange like a stock.
Large-cap: Companies with large market capitalizations, typically over $10 billion.
Small-cap: Companies with relatively small market capitalizations, usually between $300 million and $2 billion.
Expense ratio: Annual fee, expressed as a percentage of assets, that investors pay to cover fund operating costs.
Dividend yield: Annual dividends paid by a fund or stock, expressed as a percentage of its current price.
Beta: A measure of an investment's volatility compared to the overall market, typically the S&P 500.
AUM: Assets under management; the total market value of assets a fund manages.
Max drawdown: The largest percentage drop from a fund’s peak value to its lowest point over a period.
Portfolio allocation: The distribution of a fund’s assets among various sectors, industries, or securities.
Holdings: The individual securities or assets owned by a fund.
Issuer: The company or institution that creates and manages a fund or security.