The Vanguard High Dividend Yield ETF (VYM +0.32%) and the Vanguard Dividend Appreciation ETF (VIG 0.13%) both track baskets of U.S. dividend payers, but VYM emphasizes high current yield while VIG focuses on companies with a track record of growing their dividends, leading to differences in sector exposure, dividend payout, and risk profile.
Both VYM and VIG appeal to investors seeking reliable income from large-cap U.S. stocks, but they take distinct approaches: VYM targets companies with above-average yields, while VIG selects firms with consistent dividend growth. This comparison unpacks how these differences play out in cost, performance, sector tilts, and risk to help you decide which ETF to buy.
Snapshot (cost & size)
| Metric | VYM | VIG |
|---|---|---|
| Issuer | Vanguard | Vanguard |
| Expense ratio | 0.06% | 0.05% |
| 1-yr total return (as of 2026-01-11) | 19.8% | 18.6% |
| Dividend yield | 2.4% | 1.6% |
| AUM | $84.5 billion | $120.4 billion |
Beta measures price volatility relative to the S&P 500; beta is calculated from five-year weekly returns. The 1-yr return represents total return over the trailing 12 months.
VIG is slightly more affordable, but VYM offers a higher payout, making it more attractive for those who prioritize income over cost savings alone.
Performance & risk comparison
| Metric | VYM | VIG |
|---|---|---|
| Max drawdown (5 y) | (15.9%) | (20.4%) |
| Growth of $1,000 over 5 years | $1,566 | $1,573 |
What's inside the ETF portfolios
VIG is a dividend growth ETF, holding 338 stocks with a strong tilt toward technology (27.8%), followed by financial services (21.4%) and healthcare (16.7%). Its largest positions are Broadcom (AVGO +0.15%) at 7.63%, Microsoft (MSFT 0.83%) at 4.43%, and Apple (AAPL +0.62%) at 4.22%. The fund has a nearly 20-year history and limits concentration risk by capping holdings as required by its rules-based index.
VYM, by contrast, spreads its bets across 566 holdings, with the highest exposure to financial services (21%) and technology (14.3%) sectors. Industrials and healthcare have nearly equal exposure, at around 13% each. Its top stocks are Broadcom at 8.69%, JPMorgan Chase (JPM 0.17%) at 4.06%, and ExxonMobil (XOM +0.63%) and Johnson & Johnson (JNJ 0.02%)at 2.3% each.
For more guidance on ETF investing, check out the full guide at this link.
What this means for investors
The Vanguard High Dividend Yield ETF and the Vanguard Dividend Appreciation ETF and among the best dividend ETFs for income investors. The purpose and goal of the ETFs, however, are different, and that should form the basis of your buying decision.
As its name suggests, VYM's core focus is on high-yield companies. The ETF tracks the FTSE High Dividend Yield Index, which is designed to reflect the performance of companies with high dividend yields across all categories of market capitalization. The exclusive focus on yield can lead to greater exposure to mature or cyclical businesses.
VIG, in contrast, tracks the S&P U.S. Dividend Growers Index, which excludes the top 25% of the highest-yielding companies to remove risky investments with unstable dividends. Instead, the index focuses on companies that have increased their dividend payout for at least 10 years. Its focus on dividend stability and growth tends to favor stable, expanding firms.
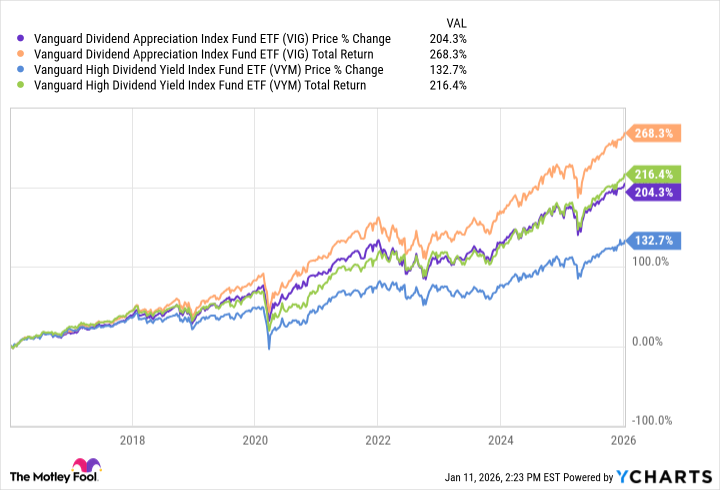
Here's my take. While high yields and an ETF like VYM may appeal more to risk-taking investors, risk-averse investors might be better off owning VIG and earning bankable dividends every year that also grow. Growing dividends can also make a substantial difference to your total returns in the long term, as the chart above shows.
Glossary
ETF: Exchange-traded fund that holds a basket of assets and trades like a stock.
Dividend yield: Annual dividends per share divided by share price, showing income return as a percentage.
Dividend growth: A strategy focusing on companies that regularly increase their dividend payments over time.
Expense ratio: Annual fund operating costs expressed as a percentage of the fund’s average assets.
AUM: Assets under management; the total market value of all assets in the fund.
Beta: Measure of an investment’s volatility compared with the overall market, often the S&P 500.
Max drawdown: The largest peak-to-trough decline in an investment’s value over a specific period.
Sector exposure: How a fund’s holdings are distributed across different industries, like technology or healthcare.
Dividend payout: The cash a company or fund distributes to shareholders from its profits.
Yield-focused strategy: Investment approach emphasizing securities that currently pay higher-than-average dividends.
Dividend growth strategy: Investment approach emphasizing companies with a consistent history of raising dividends.
Total return: Investment performance including price changes plus all dividends and distributions, assuming reinvestment.