After five years of slowing growth and a stagnant stock price, lululemon athletica (LULU -1.07%) shares have skyrocketed in 2018. The stock is up more than 80% year-to-date following a string of strong quarterly results, highlighted by improved comparable-store sales and incredible growth in online sales. In the second quarter, Lululemon's revenue and earnings per share grew 25% and 97%, respectively, over the year-ago quarter.
But those headline numbers tell only part of Lululemon's success story. The yoga retailer's growth is even more impressive when comparing key operating efficiency measures -- like inventory turnover, return on invested capital, and gross margin -- with fellow athletic apparel giants Nike (NKE +0.40%), Under Armour (UA -0.86%) (UAA -1.12%), and Adidas (ADDYY +0.14%).
We'll look at each of these important operating metrics and what they say about Lululemon's position in the competitive athletic apparel industry.

Image source: Getty Images.
1. Inventory turnover
This is one of the most important metrics for evaluating retail efficiency. Inventory turnover basically tells investors how efficient a company is at converting the inventory on store shelves into sales. The higher the number, the better.
Many shoppers are well aware that Lululemon's products are not cheap. But despite its premium pricing, Lululemon has consistently maintained a higher inventory turnover ratio than Nike, Under Armour, and Adidas.

Lululemon Inventory Turnover (TTM), data by YCharts.
The yoga apparel specialist achieved an incredible inventory turnover ratio of around 12 in 2011, as you can see in the chart. Since then, its inventory turnover has trended downward, but Lululemon has still managed to remain on top.
A few years ago, the retail industry experienced a severe slowdown in traffic, which pressured revenue growth for many companies. That partly explains why the top athletic apparel companies have lost some efficiency in moving inventory over the last five years.
But how has Lululemon managed to consistently maintain better inventory efficiency than its peers?
There are a few key reasons. First, it likes to release very limited quantities of certain styles and colors, which helps it better match supply and demand. That also makes the product more valuable in the minds of its loyal customers, who know that if a unique style comes out, they better act fast before it sells out.
Lululemon refreshes its best-selling, core styles with new colors and other features throughout the year. But the company has also made good use of limited-edition pieces designed in collaboration with celebrities from the fitness world to drive sales and move inventory faster.
It also helps that Lululemon is not spread across numerous different product categories like Nike, but instead focuses mainly on yoga and running wear. However, the company has started to branch out into shoes (in partnership with Athletic Propulsion Labs) and has also started to make clothing designed to be worn for any occasion (not just yoga class).
Given the company's recent robust growth and improvement in inventory turnover, it's clear that management is getting a good return on the investments in those new categories. This leads to the next metric where Lululemon is beating competitors.
2. Return on invested capital
Return on invested capital measures how efficient management is at generating a profit from the amount it has invested in assets like stores, distribution centers, and merchandise. Except for the period between 2014 and 2017, Lululemon has typically generated a higher return on invested capital than its main rivals.
The recent surge in margins and earnings growth has sent the company's return on invested capital to 23.4%, which is higher than its competitors, as you can see in this chart.

Lululemon Return on Invested Capital (TTM), data by YCharts.
Over the last five years, Lululemon has streamlined its supply chain and enhanced the capabilities of its design team in order to bring new styles to market a lot faster. In 2017, it launched a new website, which was easier to navigate, modern-looking, and featured better product photos. Those improvements have led to blistering growth of 55% year over year in direct-to-consumer revenue in the first half of fiscal 2018.
Online sales generate almost twice the operating margin of items sold in-store for Lululemon. Therefore the rapid growth of direct-to-consumer revenue has contributed to Lululemon's improved return on invested capital in recent quarters.
3. Gross margin
Gross profit margin is one of the best signs of strength (or weakness) in a company's competitive position. A falling gross margin points to competitive weakness, since it likely reflects low demand for merchandise, forcing the company to lower prices to generate sales.
This happened to Lululemon between 2013 and 2017, as slower store traffic caused higher markdowns. But the yoga specialist has usually generated a much higher gross margin than its peers, as you can see in the chart below.
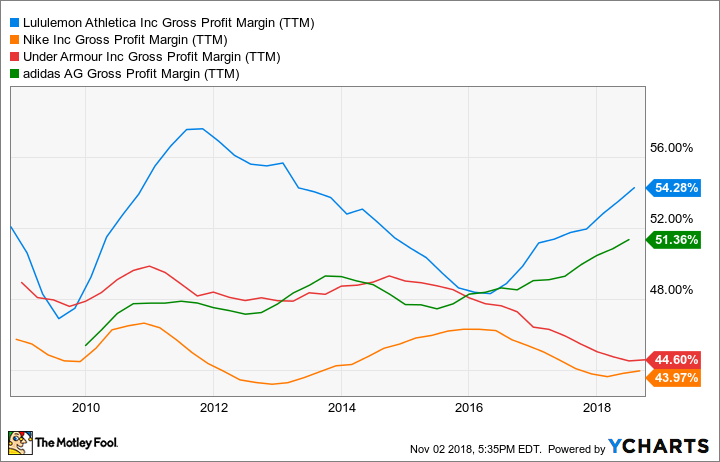
Lululemon Gross Profit Margin (TTM), data by YCharts.
Lululemon often sells out products that are priced much higher than substitutes in the marketplace. That flows into the company's superior margins and efficiency numbers relative to its peers.
Most importantly, the company's ability to generate higher gross margins reflects its very strong brand. It has a design process that turns out quality products that people are willing to pay up for. That, combined with a management team that has the right inventory strategy to squeeze more profit out of its assets, puts Lululemon in an enviable position in the retail industry.