It struck with the force of prophecy.
On Thursday, the Wall Street Journal sounded the alarm bell: The American Association of Individual Investors (AAII) was set to release its weekly update on individual sentiment, a gauge that Wall Street's best and brightest variously describe as "fascinating," "very important," and "the first thing I check."
According to the Journal, AAII's survey works as an almost flawless "contrarian" indicator of where the market will move next. Extreme bearishness at the bottom of the Great Recession in March 2009 foretold a 13-month-long, 80% rise on the Dow. Renewed skepticism in August 2010 preceded our most recent 14% rally. Indeed, according to one pundit quoted, whenever bears outnumber bulls by 10% in the AAII poll, you can expect a good 6% rise in the market over the next six months.
Conversely, when bulls outnumber bears by 30% or more, it's time to head for the hills. So ... would you care to hazard a guess what the numbers showed when AAII revealed its cards?

You guessed it -- a 30% difference between bulls and bears, almost to the decimal. Clearly, this market is headed for a fall. And naturally, the stock market today is ... going up.
Huh?
Yep. You read that right. The Journal told you what to be afraid of, then AAII confirmed that the fears are real, and investors are reacting by buying more stock. Why?
Actually, I can think of any number of reasons, including the multiple mentions of the AAII's survey's flaws in the very article that touted it. The survey tabulates "the responses of volunteers." Out of AAII's 150,000 members, usually only 200-300 bother to fill it out, and most of them are retirees with abundant free time. As a predictor of where the market is headed, the survey's "pretty much useless," and as an exercise in good research techniques, it's "statistically worthless."
"Evacuate? In our moment of triumph? I think you overestimate their chances."
Basically, after warning you that all is not well, the Journal turned around and handed you carte blanche to shrug off the warning. (In journalism circles, this is known as "fair and balanced coverage." In the real world, it's known as "CYA.") But here's the real story, Fools: The Journal was right the first time.
AAII's report may be statistically worthless, but it has great value in spurring us to take a second look at what's happening on the market today. I pulled up my own running spreadsheet of five-dozen-odd companies that I'd love to own at the right price, and ran some numbers. What did I find? Well, with apologies to George Lucas, "I've analyzed their attack, sir, and there is a danger."
The Death Star market
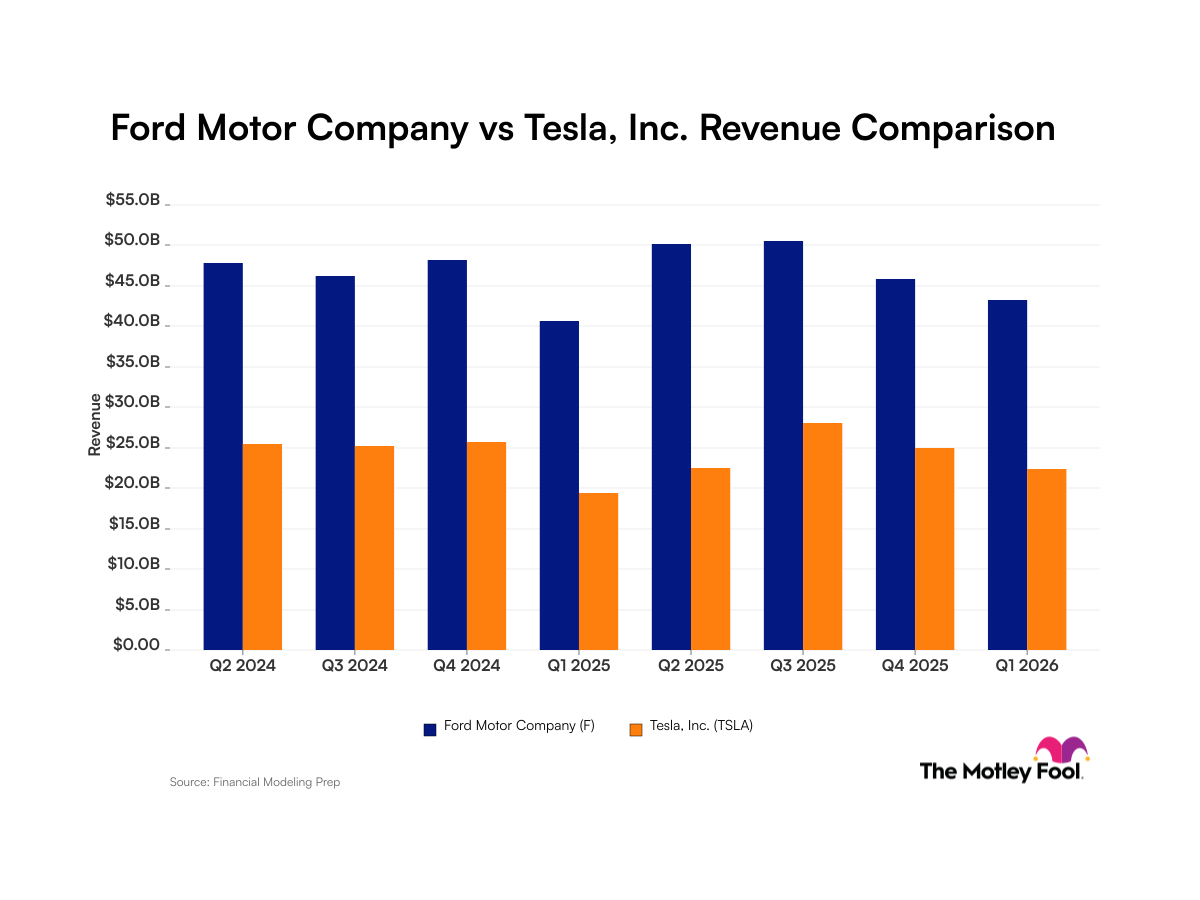
Across the length and breadth of the market, companies are selling for valuations that range from indefensible to merely uncomfortable. Ford (NYSE: F) for example, carries an enterprise value-to-free cash flow ratio roughly 30% higher than its projected long-term growth rate. MercadoLibre's (Nasdaq: MELI) overvaluation reaches 40%, and eBay (Nasdaq: EBAY) looks to be as much as twice as pricey as it should be.
Some of the outliers are even scarier. Netflix (Nasdaq: NFLX) may be the hottest stock on the block these days, but at an EV/FCF/Growth ratio of 3.2, it's priced for perfection. When I noticed that Under Armour (NYSE: UA) now scores a 4.0 on this scale (making it literally the priciest stock on my list), I actually went out and shorted the stock (something I almost never do).
Nor are these isolated examples. Reviewing the valuations on eight of the major market sectors (excepting only the financial sector, for which EV/FCF is a useless metric), I found seven of the eight looking dangerously overpriced. Utilities, where the average stock carries a price-to-free cash flow ratio of 49, but is pegged for only single-digit growth over the next five years, looks particularly primed for a sell-off. But everywhere you look -- basic materials, consumer goods, health care, industrials, services, and technology -- bargains are becoming scarce indeed.
Aside from that, Mrs. Lincoln...
Before you go wandering off in search of sharp objects, know that not all is lost. Just because "the stock market" is expensive doesn't mean you have to buy it. You can avoid the overpriced stocks, and sectors, I named above.
The same spreadsheet I use to identify and avoid overpriced stocks shows that there are still bargains out there. Global consulting powerhouse Accenture (NYSE: ACN), for example, seems perpetually undervalued, and always worth buying. Intel (Nasdaq: INTC), as I mentioned earlier this week, carries an entirely reasonable valuation -- and I'm sure there are others out there. Within the Conglomerates sector in particular, the average stock sells for less than 12 times free cash flow, but it's expected to grow more than 15% per year going forward, and it pays a 2.2% dividend to boot.
You can still "go long" on selected stocks -- even in an overpriced market. But please, folks, let's be careful out there.