Shares of Advanced Micro Devices (NYSE: AMD) hit a 52-week low yesterday. Let's take a look at how it got here to find out whether there are still cloudy skies ahead.
How it got here
AMD's been charting new lows for a while, as its stock has moved almost exclusively lower since early spring. The company's weak quarterly earnings this summer have not retreated from investors' minds, but there have been several key new pieces of information that we can point out as contributors to the long decline. This parade of negativity has helped make AMD one of the worst-performing major semiconductor stocks on the market, if not the worst:
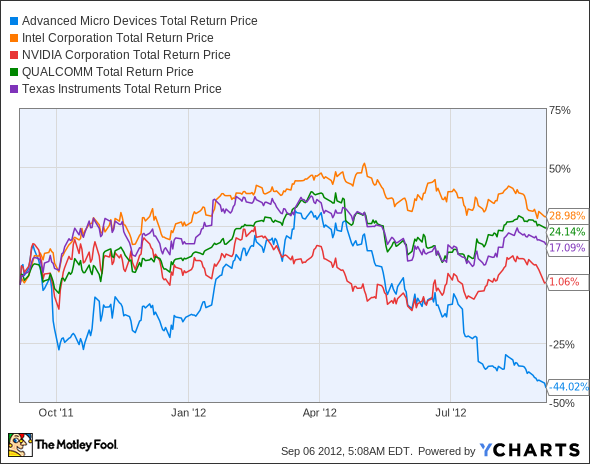
AMD Total Return Price data by YCharts.
Yowch. NVIDIA (Nasdaq: NVDA) hasn't done much, but at least it's clinging to gains for the past year. Meanwhile, Intel (Nasdaq: INTC) leads a pack of rising chip champs that includes Qualcomm (Nasdaq: QCOM) and Texas Instruments (NYSE: TXN). Intel's actually expecting slower growth in the current quarter, while NVIDIA anticipates an uptick, so you may see the graphics specialist rise to match the rest by year's end.
AMD's situation doesn't look particularly pretty. Fool contributor Anders Bylund points out the company's ugly debt overhang, while Fool analyst Evan Niu noted that one executive who played a major role in AMD's graphics division jumped ship to NVIDIA in July. With all these problems swirling, AMD has become the subject of buyout rumors. The sugar daddies? A tag team of Qualcomm and Samsung. I wouldn't hold my breath for this one, though.
At this point, is AMD worth a closer look, or is it time to swap this chip maker out for a newer model? Let's dig into some numbers to see what we can find.
What you need to know
Despite weak margins, AMD's sporting a single-digit price-to-free-cash-flow ratio, as its levels of free cash flow have recently ticked up into positive territory:
|
Company |
P/E Ratio |
Price to Levered Free Cash Flow |
Net Margin (TTM) |
Projected Growth Rate (2013) |
|---|---|---|---|---|
| AMD | NM | 6.2 | (9.9%) | 50.0% |
| NVIDIA | 17.6 | 16.5 | 11.9% | 32.4% |
| Intel | 10.3 | 19.2 | 23.2% | 6.8% |
| Qualcomm | 17.9 | 24.1 | 32.1% | 12.4% |
| Texas Instruments | 20.9 | 14.5 | 12.1% | 8.0% |
Source: Yahoo! Finance. TTM = trailing 12 months. NM = not meaningful.
Analysts also expect AMD to post the strongest growth of any of these companies. Intel and Texas Instruments are barely moving in analysts' view by comparison. It wasn't that long ago that AMD hung out in positive P/E territory, either -- the company's P/E averaged in the single digits from the start of 2010 to the end of 2011:

AMD Free Cash Flow TTM data by YCharts.
AMD's debt levels, while high, are also moving in the right direction. The company effectively refinanced some of that debt last month, as well. The problem isn't just debt, but competitive threats and the risk that AMD is getting left behind by the mobile shift. Every one of these companies has made a concerted push into mobile -- except AMD, which seems content to make tentative forays into tablets and notebooks.
What's next?
Where does AMD go from here? PCs appear to be a stagnant market now, and it's one long dominated by Intel. Since laptops are officially counted as part of the PC market, that leaves tablets. AMD's got an steep uphill battle against Qualcomm and NVIDIA, among others, in that space. If AMD's growth hinges on it toppling established leaders in fiercely contested segments, you might as well walk away. It's got no real track record of success there.
Whether you're thinking of investing or you simply need the dirt on the competition, consider a subscription to The Motley Fool's premium research service covering Intel. It comes with a full year of regular updates, so you won't have to worry about missing a big move from silicon sector's bellwether. Click here to subscribe to our Intel research service today.