Accessibility Menu
Churchill Downs logo

Churchill Downs(NASDAQ) CHDN

Market Cap$6.53BMarket cap calculated using publicly traded shares outstanding only. Does not include unlisted, private, or dual-class non-traded shares. Implied market cap may vary.
Since IPO (1975)+128,581%
5 Year-0%
1 Year-8%
1 Month+14%
Premium Feature
Moneyball Superscore
67/100
$93.75
+0.68%
+0.63Today
After hours$93.69-$0.06 (-0.06%)
Churchill Downs last closing stock price
MetricPriceDate
Last closeUSD 93.712026-08-21
Churchill Downs stock price return by period
PeriodPrice returnPrice at period startPeriod start date
1 week+3.18%USD 90.822026-08-14
1 month+14.09%USD 82.142026-07-22
3 month+10.09%USD 85.122026-05-22
Year to date-17.64%USD 113.782025-12-31
1 year-8.18%USD 102.062025-08-21
3 year-23.64%USD 122.722023-08-22
5 year-0.06%USD 93.772021-08-20
Since inception+128,580.56%USD 0.071975-01-06

Churchill Downs Financials at a Glance

Market Cap

$6.53BMarket cap calculated using publicly traded shares outstanding only. Does not include unlisted, private, or dual-class non-traded shares. Implied market cap may vary.

Revenue (TTM)

$2.99B

Net Income (TTM)

$409.70M

EPS (TTM)

$5.83

P/E Ratio

16.08

Dividend

$0.44

Beta (Volatility)

0.95 (Low)

Price

$93.75

Volume

931,038.774

Open

$93.14

Previous Close

$93.71

Daily Range

$91.84 - $93.92

52-Week Range

$79.40 - $118.35

Estimated Earnings Date

Oct 28, 2026

CHDN: Motley Fool Moneyball Superscore

67

Our CEO Is Handing Members His Secret Weapon

It's called Motley Fool Moneyball, our new proprietary AI tool

We spent over half a million dollars in R&D to build a tool that makes stock research faster, sharper, and smarter. Our analysts use it every day, and now, you can too.

Get Access Now

About Churchill Downs

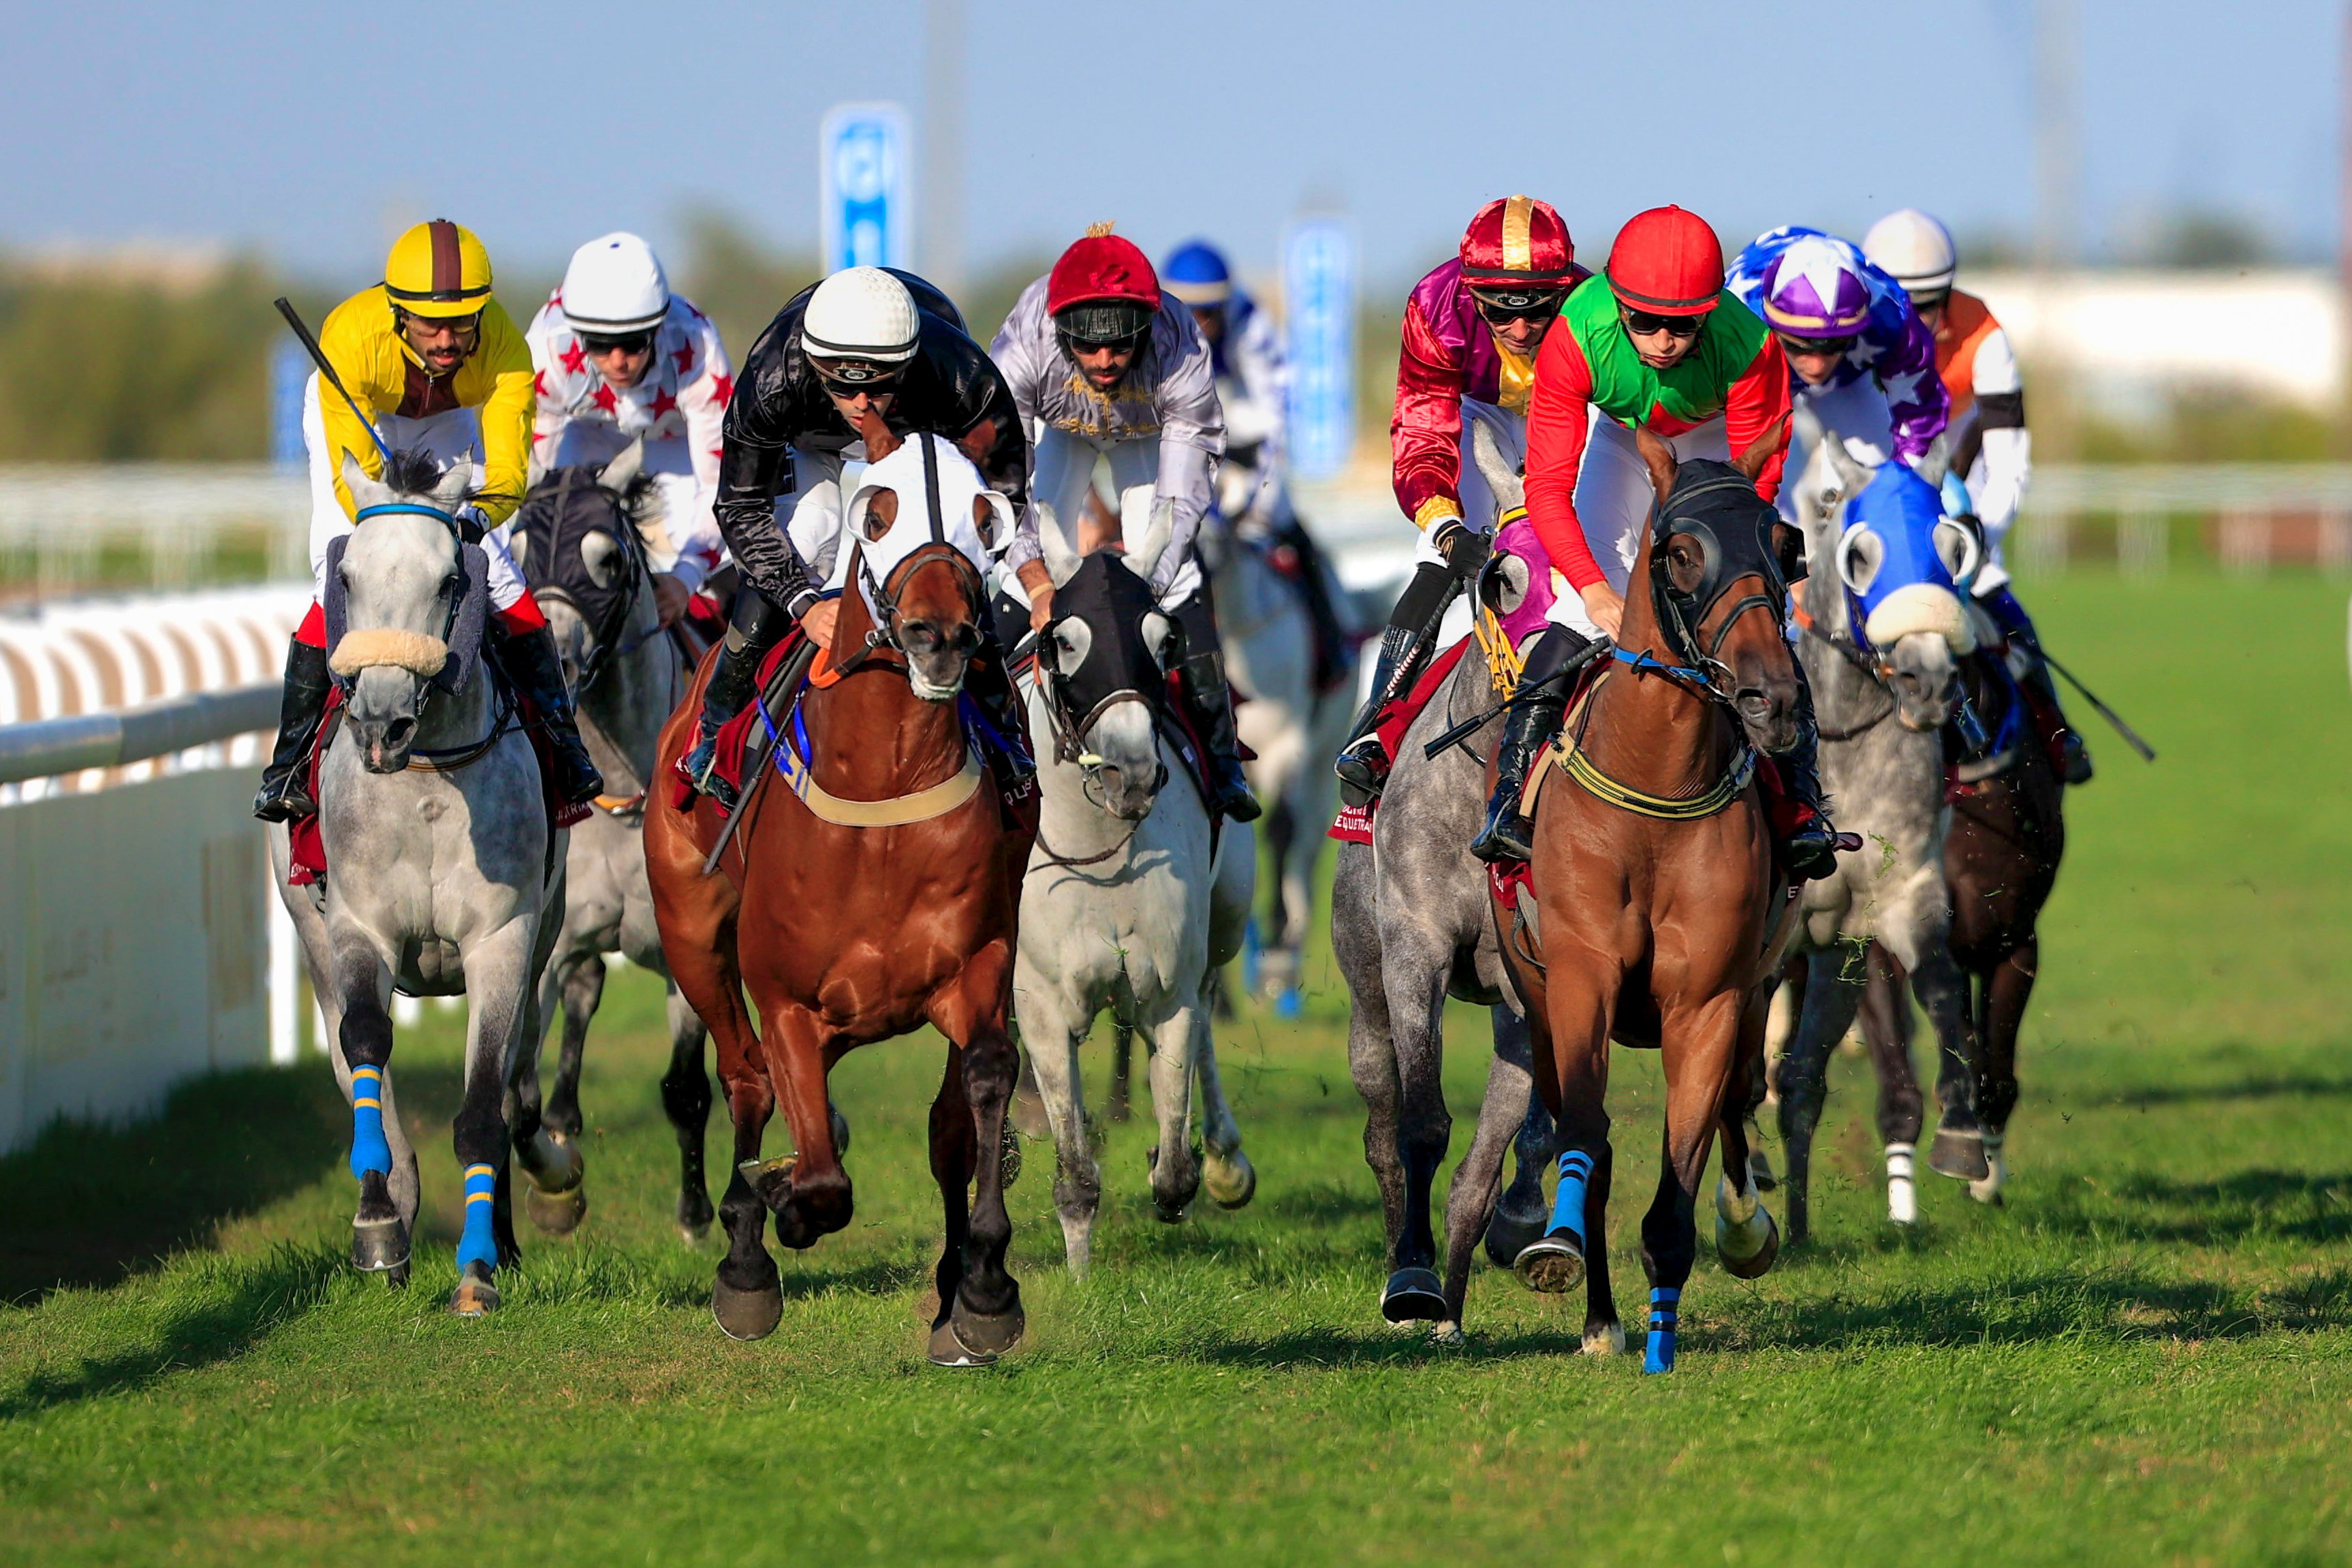
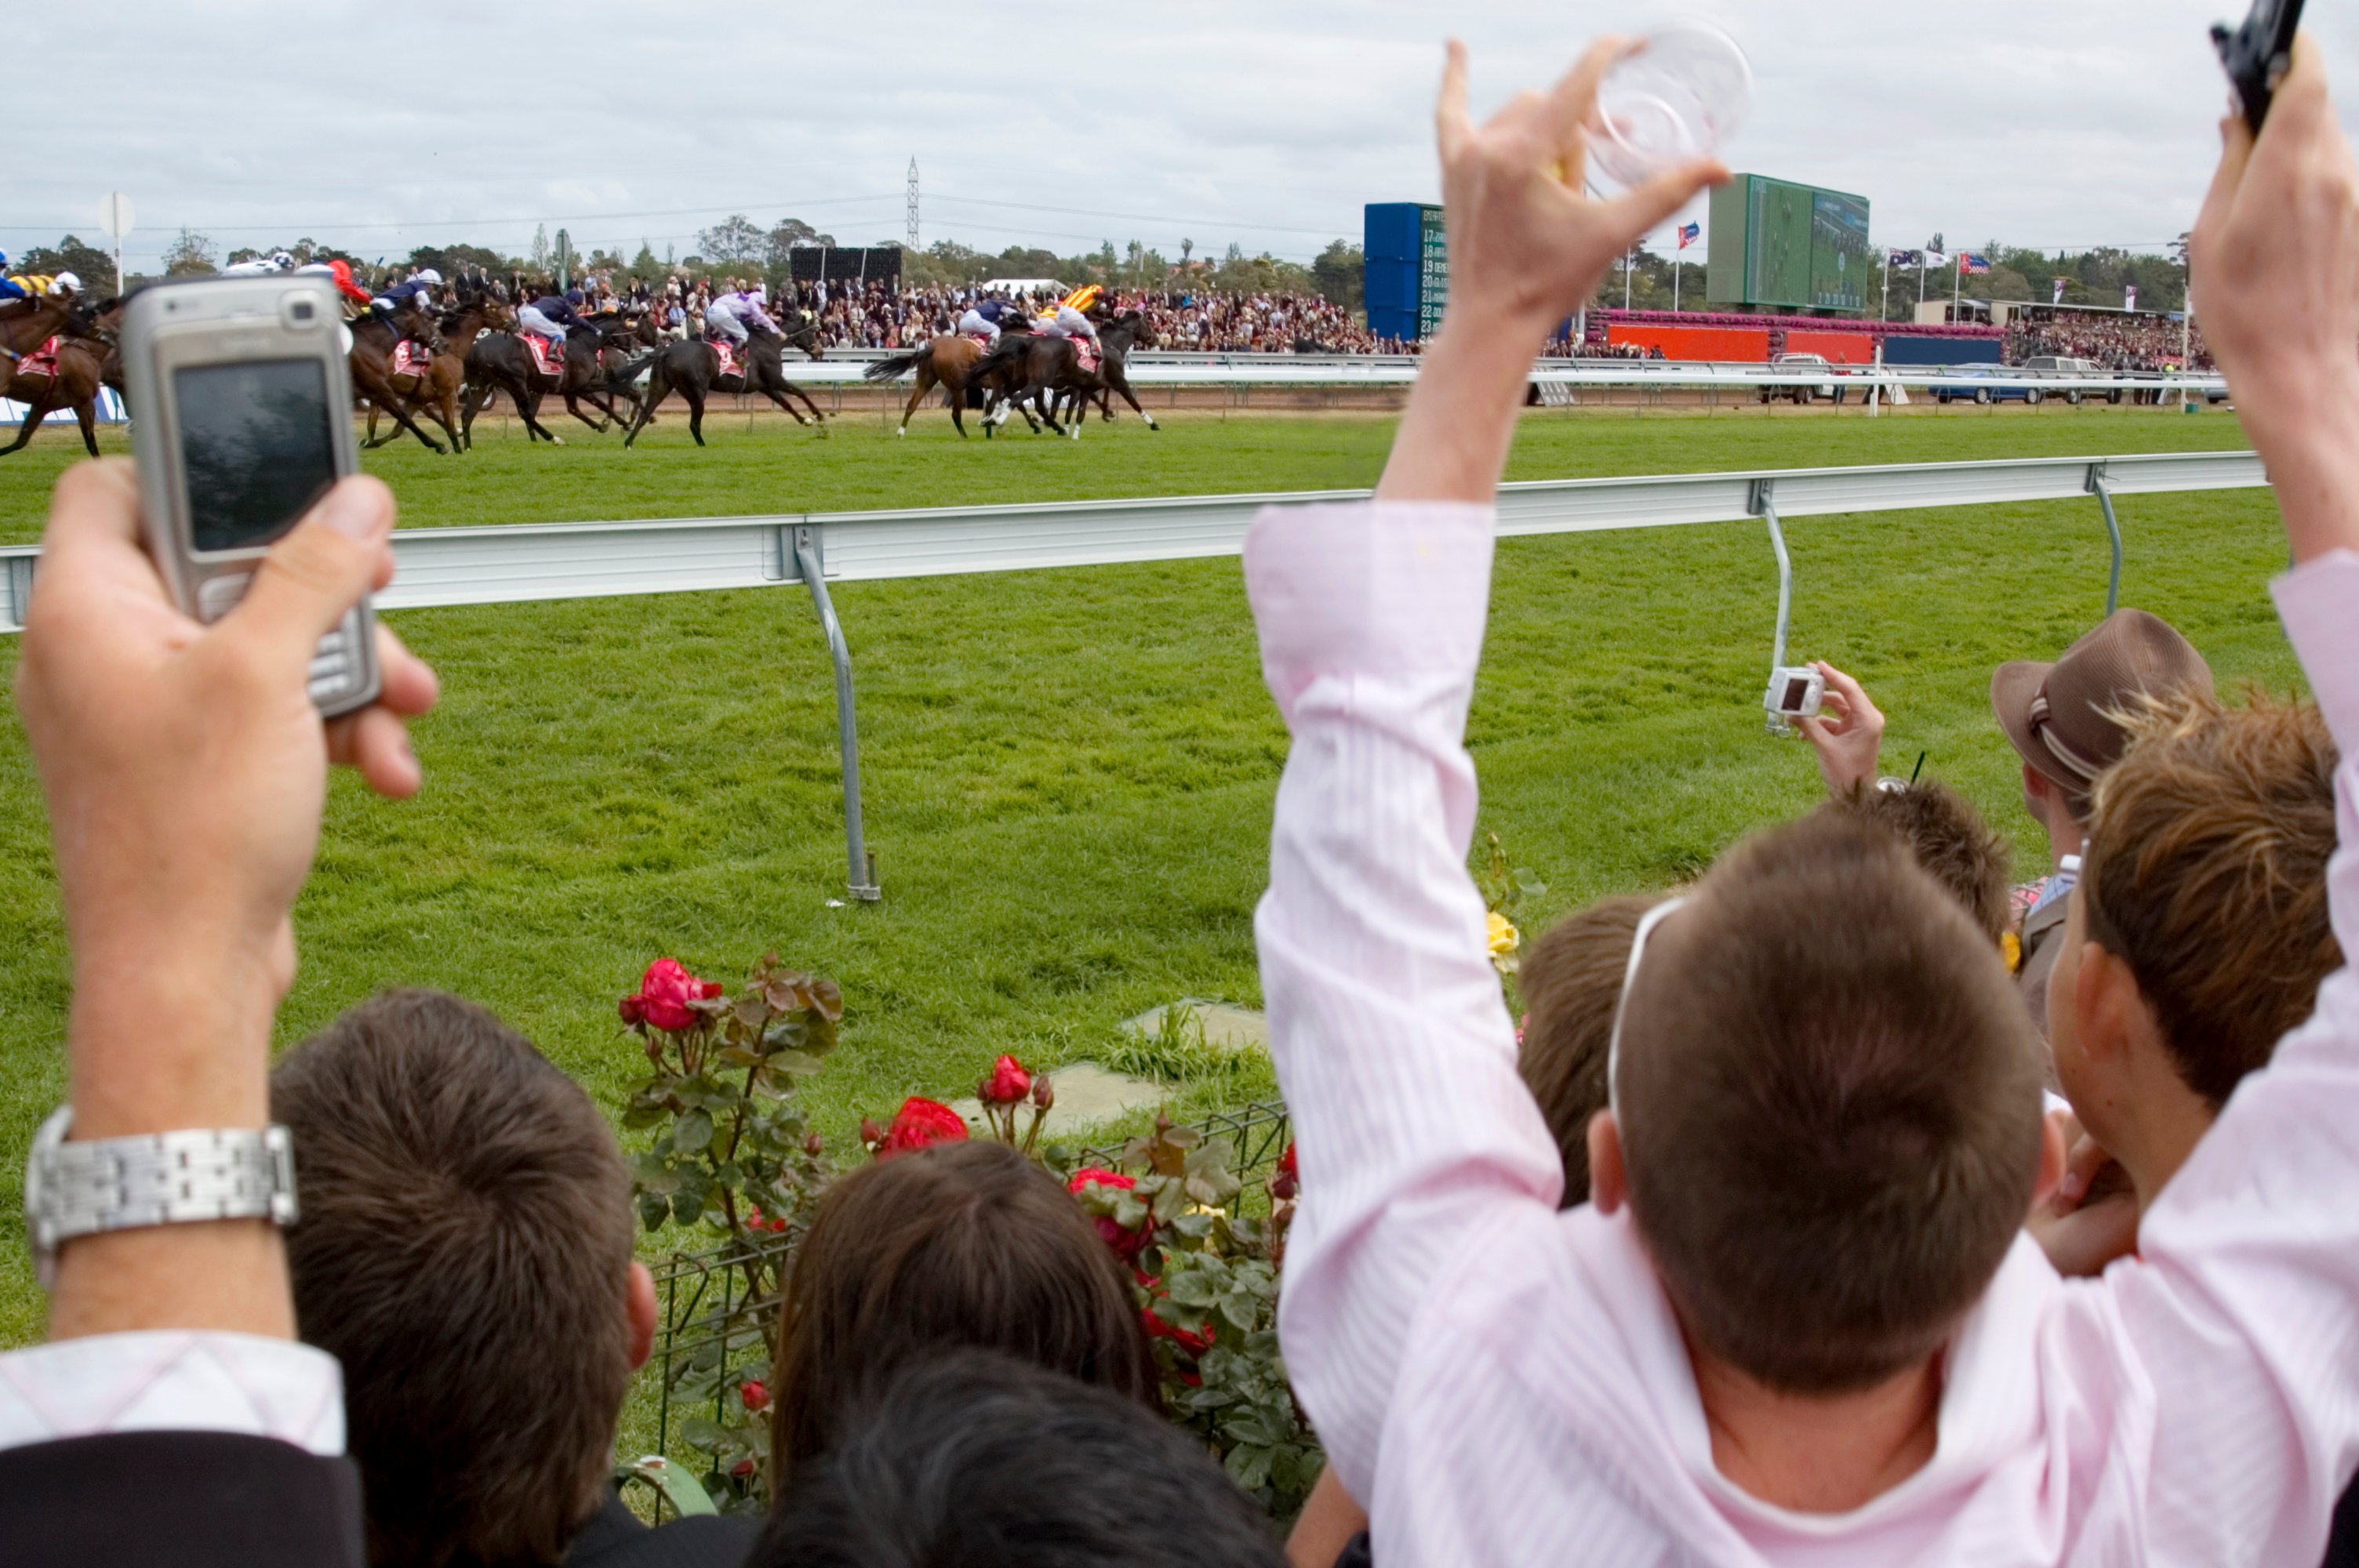
Churchill Downs Incorporated runs horse races and gambling venues. It helps people bet on sports and play casino games. The company also hosts the Kentucky Derby race every year.

Horse Racing and Casino Games

  • Live and Historical Racing: Live horse racing and historical racing machines (HRM) that let people bet on the outcomes of horse races that have already happened; revenue was $575 million in the three-month period ended June 30, 2026.
  • Wagering Services and Solutions: Digital platforms for betting on horse races and sports through retail and online systems; revenue was $178 million in the three-month period ended June 30, 2026.
  • Gaming: Physical casinos featuring approximately 11,000 slot machines and 200 table games across eight states; revenue was $270 million in the three-month period ended June 30, 2026.

Strategic Moves and New Venues

  • Discontinued all historical racing machine operations in Louisiana on May 8, 2025, following a state court ruling.
  • Relocated approximately 500 gaming machines from Louisiana to properties in Virginia to maintain operational capacity.
  • Began construction of the Rockingham Grand Casino in New Hampshire to expand long-term gaming presence in the state.
  • Implemented a $500 million stock repurchase program in July 2025 to buy back company shares.

Unique Assets and Data Systems

Churchill Downs uses its 150-year history with the Kentucky Derby to drive revenue from ticketing, sponsorships, and broadcasting. The company also develops proprietary wagering systems and provides racing statistical data to other betting facilities.

Financial Results and Debt

  • Net revenue reached $980 million in the three-month period ended June 30, 2026, up $46 million from the prior year.
  • Operating income rose to $357 million in the three-month period ended June 30, 2026, up $30 million year over year.
  • Market capitalization was $6.3 billion in Q2 2026, which was a 13.4% decrease from $7.2 billion in Q2 2025.
  • Total debt was $4.8 billion on June 30, 2026, compared to $5.2 billion at the end of 2025.

Evolution of the Business

Churchill Downs has transformed from a traditional racetrack operator into a diversified gaming and digital wagering firm. Its expansion into historical racing machines and regional casinos provides consistent revenue throughout the calendar year.

AI Generated • Aug 4, 2026

Industry

Hotels, Restaurants and Leisure

Employees

9,000

CEO

William C. Carstanjen

Headquarters

Louisville, KY 40222, US

CHDN Financials

Key Financial Metrics (TTM)

Gross Margin

52.94%

Operating Margin

24.21%

Net Income Margin

13.69%

Return on Equity

36.57%

Return on Capital

11.86%

Return on Assets

5.45%

Earnings Yield

6.22%

Dividend Yield

0.47%

Payout Ratio

7.76%

Stock Overview

Market Cap

$6.53BMarket cap calculated using publicly traded shares outstanding only. Does not include unlisted, private, or dual-class non-traded shares. Implied market cap may vary.

Shares Outstanding

69.70M

Volume

931.04K

Avg. Volume

1.01M

Financials (TTM)

Gross Profit

$1.58B

Operating Income

$724.20M

EBITDA

$1.12B

Operating Cash Flow

$794.80M

Capital Expenditure

-$412.20M

Free Cash Flow

$382.60M

Cash & ST Invst.

$196.00M

Total Debt

$4.78B

Churchill Downs Performance Analysis

Churchill Downs annual revenue and year-over-year revenue growth by fiscal year
Fiscal yearPeriod endRevenueYoY growth
20222022-12-31USD 1,809,800,00013.3%
20232023-12-31USD 2,461,700,00036.0%
20242024-12-31USD 2,734,300,00011.1%
20252025-12-31USD 2,925,900,0007.0%
Churchill Downs sequential (quarter-over-quarter) revenue growth by fiscal quarter
Fiscal quarterPeriod endQoQ growth
Q32025-09-30-26.9%
Q42025-12-31-2.5%
Q12026-03-31-0.4%
Q22026-06-3047.8%
Churchill Downs annual diluted earnings per share and year-over-year EPS growth by fiscal year
Fiscal yearPeriod endDiluted EPSYoY growth
20222022-12-31USD 5.7179.6%
20232023-12-31USD 5.48-3.9%
20242024-12-31USD 5.683.6%
20252025-12-31USD 5.29-6.9%
Churchill Downs sequential (quarter-over-quarter) diluted earnings per share growth by fiscal quarter
Fiscal quarterPeriod endQoQ growth
Q32025-09-30-82.3%
Q42025-12-3134.0%
Q12026-03-3163.4%
Q22026-06-30196.6%

Revenue Growth Rate

Annual and quarterly growth comparison

Earnings Per Share Growth Rate

Annual and quarterly EPS growth comparison

Quarterly Performance

Name
Q2 2026YOY CHG

Revenue

$980.00M

+4.9%

Gross Profit

$980.00M

+149.9%

Gross Margin

100.00%

N/A

Market Cap

$6.53BMarket cap calculated using publicly traded shares outstanding only. Does not include unlisted, private, or dual-class non-traded shares. Implied market cap may vary.

N/A

Market Cap/Employee

$837.39K

N/A

Employees

7,800

N/A

Net Income

$241.00M

+11.1%

EBITDA

$457.00M

+7.4%

Quarterly Fundamentals

Name
Q2 2026YOY CHG

Total Cash

$196.00M

+7.5%

Total Debt

$4.78B

-4.6%

Accounts Receivable

$129.00M

+9.0%

Inventory

$11.00M

-12.7%

Long Term Debt

$4.11B

-16.8%

Short Term Debt

$671.00M

+833.2%

Return on Assets

5.45%

N/A

Return on Invested Capital

11.75%

N/A

Free Cash Flow

$159.00M

+2.6%

Operating Cash Flow

$217.00M

-9.6%

Other Investments to Explore

People Also Watch

Symbol / CompanyPricePrice Chg
BIRKBirkenstock Holding plc
$35.64+3.17%
SGHCSuper Group (SGHC) Limited
$13.31+0.68%
HRBH&R Block, Inc.
$53.68+1.21%
BYDBoyd Gaming Corporation
$80.78-0.21%

Trending Stocks

Symbol / CompanyPricePrice Chg
TSLLDirexion Shares ETF Trust - Direxion Daily Tsla Bull 2x ETF
$9.77+0.10%
IBITiShares Bitcoin Trust
$43.68+0.06%
BITOProShares Trust - ProShares Bitcoin ETF
$10.41+0.06%
MARAMara Holdings
$11.26+0.01%

Questions About CHDN

What is the current price of Churchill Downs?

Churchill Downs is trading at $93.71 per share.

What is the 52-week range for Churchill Downs?

Over the past 52 weeks, Churchill Downs has traded between $79.40 and $118.35.

How much debt does Churchill Downs have?

As of the most recent reporting period, Churchill Downs reported total debt of $4.78B.

How much cash does Churchill Downs have on hand?

Churchill Downs reported $295.00M in cash and cash equivalents in its most recent financial results.

What is Churchill Downs’s dividend yield?

Churchill Downs currently has a dividend yield of 0.47%.

Premium Investing Services

Invest better with The Motley Fool. Get stock recommendations, portfolio guidance, and more from The Motley Fool's premium services.