Accessibility Menu
Diamondback Energy logo

Diamondback Energy(NASDAQ) FANG

Market Cap$55.96BMarket cap calculated using publicly traded shares outstanding only. Does not include unlisted, private, or dual-class non-traded shares. Implied market cap may vary.
Since IPO (2012)+1,402%
5 Year+222%
1 Year+42%
1 Month+3%
Premium Feature
Moneyball Superscore
65/100
$198.29
-0.78%
-1.55Today
Diamondback Energy last closing stock price
MetricPriceDate
Last closeUSD 199.842026-08-26
Diamondback Energy stock price return by period
PeriodPrice returnPrice at period startPeriod start date
1 week-4.18%USD 208.552026-08-19
1 month+2.63%USD 194.732026-07-27
3 month+3.5%USD 193.082026-05-28
Year to date+35.2%USD 147.812025-12-31
1 year+42.16%USD 140.572025-08-26
3 year+49.15%USD 133.992023-08-25
5 year+222.2%USD 62.022021-08-27
Since inception+1,401.94%USD 13.312012-10-12

Diamondback Energy Financials at a Glance

Market Cap

$55.96BMarket cap calculated using publicly traded shares outstanding only. Does not include unlisted, private, or dual-class non-traded shares. Implied market cap may vary.

Revenue (TTM)

$17.10B

Net Income (TTM)

$1.59B

EPS (TTM)

$5.16

P/E Ratio

38.72

Dividend

$4.25

Beta (Volatility)

0.78 (Low)

Price

$198.29

Volume

1,795.272

Open

$197.93

Previous Close

$199.84

Daily Range

$196.65 - $202.00

52-Week Range

$134.30 - $216.90

Estimated Earnings Date

Nov 2, 2026

About Diamondback Energy

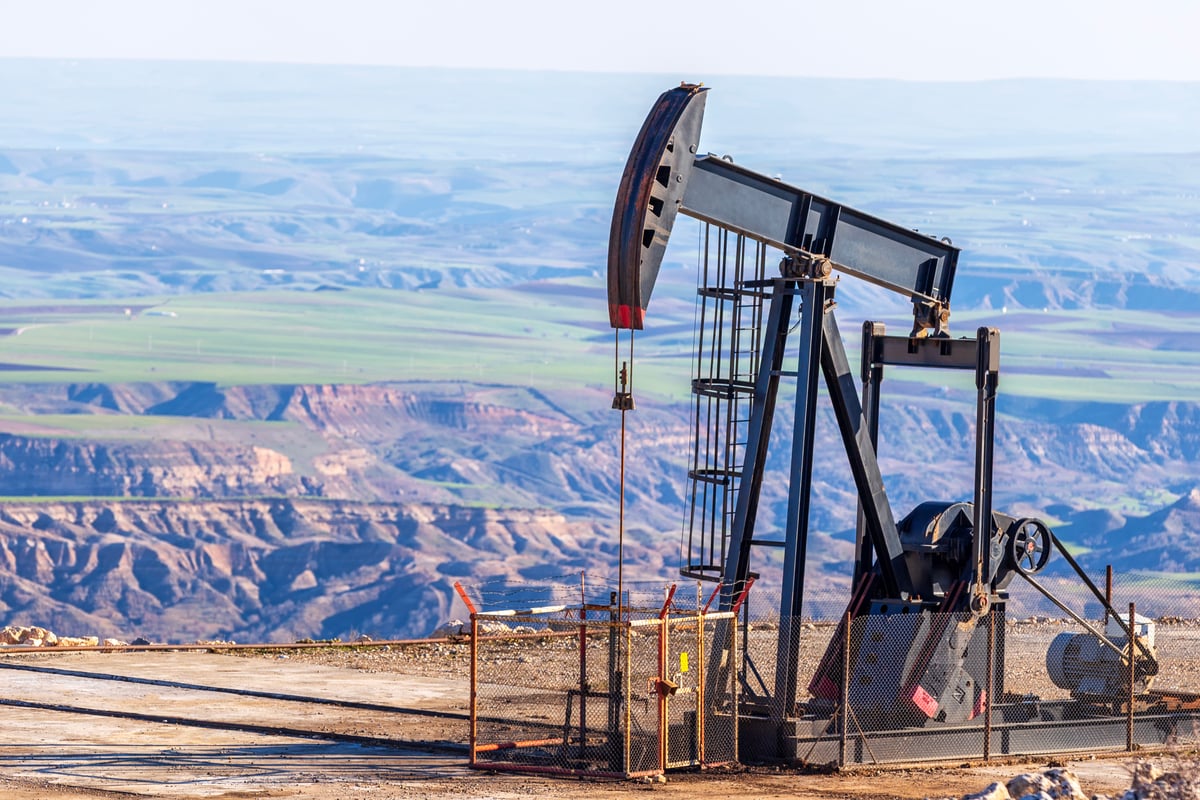
Diamondback Energy, Inc. pulls oil and gas from deep underground. These resources help fuel cars and heat many American homes. The company works in a large energy region in Texas.

What Diamondback Pulls From the Ground

  • Upstream Production: Extraction of oil and natural gas in the Permian Basin; accounts for all of the company's reportable business segments.
  • Crude Oil: Production of liquid petroleum sold to refineries; generated $4.6 billion in sales during the second quarter of 2026.
  • Natural Gas Liquids: Byproducts like propane and butane used for heating and chemicals; brought in $435 million during the second quarter of 2026.
  • Royalty Interests: Ownership of rights to income from wells through the subsidiary Viper; includes interests in 44,314 gross wells as of June 30, 2026.

Strategic Moves and New Assets

  • Acquired the equity interests of Riverbend on July 1, 2026, for approximately $339 million in cash and stock.
  • Increased the common stock repurchase program authorization from $8.0 billion to $16.0 billion on July 30, 2026.
  • Entered an agreement on August 3, 2026, to move mineral and royalty interests to its subsidiary, Viper.
  • Executed new contracts to expand infrastructure and increase takeaway capacity for natural gas later in 2026.

Efficiency in a Famous Oil Region

Diamondback focuses its operations exclusively on horizontal development within the Wolfcamp, Spraberry, and Bone Spring formations of the Permian Basin. The company maintains its own midstream infrastructure, which includes 866 miles of pipelines and water systems to manage production logistics across West Texas.

The Recent Financial Scorecard

  • Total oil, natural gas, and natural gas liquid revenues rose 23% to $8.6 billion for the six months ended June 30, 2026.
  • Net income reached $1.9 billion in the second quarter of 2026.
  • Daily production surpassed the milestone of 1.0 million barrels of oil equivalent in the second quarter of 2026.
  • Cash operating costs were $10.96 per barrel of oil equivalent during the second quarter of 2026.

Bottom Line

Diamondback has evolved into a major Permian Basin producer by combining large-scale oil production with its own pipeline and royalty businesses. Its focus on drilling efficiency and strategic asset deals helps it maintain a strong position in the American energy market.

AI Generated • Aug 6, 2026

Industry

Oil, Gas and Consumable Fuels

Sector

Energy

Employees

1,762

CEO

Matthew Kaes Van't Hof

Headquarters

Midland, TX 79701, US

FANG Financials

Key Financial Metrics (TTM)

Gross Margin

44.46%

Operating Margin

27.68%

Net Income Margin

9.27%

Return on Equity

4.22%

Return on Capital

9.48%

Return on Assets

2.26%

Earnings Yield

2.58%

Dividend Yield

2.13%

Payout Ratio

91.99%

Stock Overview

Market Cap

$55.96BMarket cap calculated using publicly traded shares outstanding only. Does not include unlisted, private, or dual-class non-traded shares. Implied market cap may vary.

Shares Outstanding

280.02M

Volume

1.80K

Avg. Volume

2.23M

Financials (TTM)

Gross Profit

$7.60B

Operating Income

$4.73B

EBITDA

$7.13B

Operating Cash Flow

$10.14B

Capital Expenditure

-$3.65B

Free Cash Flow

$6.50B

Cash & ST Invst.

$462.00M

Total Debt

$12.61B

Diamondback Energy Performance Analysis

Diamondback Energy annual revenue and year-over-year revenue growth by fiscal year
Fiscal yearPeriod endRevenueYoY growth
20222022-12-31USD 9,643,000,00041.9%
20232023-12-31USD 8,412,000,000-12.8%
20242024-12-31USD 11,066,000,00031.6%
20252025-12-31USD 15,026,000,00035.8%
Diamondback Energy sequential (quarter-over-quarter) revenue growth by fiscal quarter
Fiscal quarterPeriod endQoQ growth
Q32025-09-307.5%
Q42025-12-31-14.0%
Q12026-03-3125.6%
Q22026-06-3031.2%
Diamondback Energy annual diluted earnings per share and year-over-year EPS growth by fiscal year
Fiscal yearPeriod endDiluted EPSYoY growth
20222022-12-31USD 24.61100.0%
20232023-12-31USD 17.34-29.5%
20242024-12-31USD 15.53-10.4%
20252025-12-31USD 5.73-63.1%
Diamondback Energy sequential (quarter-over-quarter) diluted earnings per share growth by fiscal quarter
Fiscal quarterPeriod endQoQ growth
Q32025-09-3047.1%
Q42025-12-31-246.0%
Q12026-03-31101.6%
Q22026-06-308212.5%

Revenue Growth Rate

Annual and quarterly growth comparison

Earnings Per Share Growth Rate

Annual and quarterly EPS growth comparison

Quarterly Performance

Name
Q2 2026YOY CHG

Revenue

$5.56B

+52.3%

Gross Profit

$2.51B

+98.7%

Gross Margin

45.16%

N/A

Market Cap

$55.96BMarket cap calculated using publicly traded shares outstanding only. Does not include unlisted, private, or dual-class non-traded shares. Implied market cap may vary.

N/A

Market Cap/Employee

$31.76M

N/A

Employees

1,762

N/A

Net Income

$1.88B

+169.2%

EBITDA

$3.96B

+75.7%

Quarterly Fundamentals

Name
Q2 2026YOY CHG

Total Cash

$462.00M

+111.0%

Total Debt

$12.61B

-16.6%

Accounts Receivable

$1.93B

+25.8%

Inventory

$67.00M

-41.7%

Long Term Debt

$11.07B

-26.8%

Short Term Debt

$1.55B

+10957.1%

Return on Assets

2.26%

N/A

Return on Invested Capital

7.33%

N/A

Free Cash Flow

$2.59B

+212.2%

Operating Cash Flow

$3.59B

+114.0%

Other Investments to Explore

People Also Watch

Symbol / CompanyPricePrice Chg
OXYOccidental Petroleum Corporation
$58.20-0.72%
LNGCheniere Energy, Inc.
$282.13-0.69%
OKEONEOK, Inc.
$94.10-0.85%
WDSWoodside Energy Group Ltd
$22.95+0.22%

Trending Stocks

Symbol / CompanyPricePrice Chg
NVDANvidia
$209.66-0.02%
SOXLDirexion Shares ETF Trust - Direxion Daily Semiconductor Bull 3x ETF
$116.60+0.01%
ETHAiShares Ethereum Trust - iShares Ethereum Trust ETF
$18.65+0.00%
SOXSDirexion Shares ETF Trust - Direxion Daily Semiconductor Bear 3x ETF
$48.09-0.01%

Questions About FANG

What is the current price of Diamondback Energy?

Diamondback Energy is trading at $199.84 per share.

What is the 52-week range for Diamondback Energy?

Over the past 52 weeks, Diamondback Energy has traded between $134.30 and $216.90.

How much debt does Diamondback Energy have?

As of the most recent reporting period, Diamondback Energy reported total debt of $12.61B.

How much cash does Diamondback Energy have on hand?

Diamondback Energy reported $464.00M in cash and cash equivalents in its most recent financial results.

What is Diamondback Energy’s dividend yield?

Diamondback Energy currently has a dividend yield of 2.13%.

Premium Investing Services

Invest better with The Motley Fool. Get stock recommendations, portfolio guidance, and more from The Motley Fool's premium services.