Equinix logo

Equinix(NASDAQ) EQIX

Market Cap$94.23BMarket cap calculated using publicly traded shares outstanding only. Does not include unlisted, private, or dual-class non-traded shares. Implied market cap may vary.
Since IPO (2000)+211%
5 Year+29%
1 Year+17%
1 Month-8%
Premium Feature
Moneyball Superscore
82/100
$955.90
+0.34%
+3.28Today
After hours$952.00-$3.90 (-0.41%)
Equinix last closing stock price
MetricPriceDate
Last closeUSD 955.032026-10-23
Equinix stock price return by period
PeriodPrice returnPrice at period startPeriod start date
1 week-3.14%USD 985.982026-10-16
1 month-7.96%USD 1,037.662026-09-23
3 month-11.5%USD 1,079.082026-07-24
Year to date+26.55%USD 754.652025-12-31
1 year+17.25%USD 814.502025-10-23
3 year+44.52%USD 660.812023-10-24
5 year+28.5%USD 743.202021-10-22
Since inception+210.66%USD 307.422000-08-11

Equinix Financials at a Glance

Market Cap

$94.23BMarket cap calculated using publicly traded shares outstanding only. Does not include unlisted, private, or dual-class non-traded shares. Implied market cap may vary.

Revenue (TTM)

$9.83B

Net Income (TTM)

$1.53B

EPS (TTM)

$15.54

P/E Ratio

61.46

Dividend

$20.17

Beta (Volatility)

0.87 (Low)

Price

$955.90

Volume

605,659.857

Open

$941.15

Previous Close

$955.03

Daily Range

$935.84 - $957.00

52-Week Range

$720.62 - $1,128.68

Estimated Earnings Date

Oct 28, 2026

EQIX: Motley Fool Moneyball Superscore

82

Our CEO Is Handing Members His Secret Weapon

It's called Motley Fool Moneyball, our new proprietary AI tool

We spent over half a million dollars in R&D to build a tool that makes stock research faster, sharper, and smarter. Our analysts use it every day, and now, you can too.

Get Access Now

About Equinix

Equinix NASDAQ:EQIX helps companies store and connect their digital data safely. It runs a global network of specialized buildings for computer servers. These centers let businesses share data quickly with partners and customers.

What Powers the Digital World?

  • Colocation Services: Providing secure space and power for customer servers; included in recurring revenue that is over 90% of revenue.
  • Interconnection Solutions: Physical and virtual links that let businesses exchange data directly; included in recurring revenue that is over 90% of revenue.
  • Professional Services: Installation and technical consulting for digital infrastructure setups; represents less than 10% of revenue.
  • Edge Solutions: Tools for deploying networking and hardware closer to where data is actually used.

Global Expansion and New Partnerships

  • Sold the Hampton Campus data center assets in Jan. 2026 for $459 million.
  • Agreed to contribute up to $963 million in Feb. 2026 for a stake in Nordic provider atNorth.
  • Issued $2.4 billion in senior notes during the first half of 2026 to support business growth.
  • Reached a global footprint of 282 data centers across 77 markets as of June 30, 2026.

Why the Company Stands Out

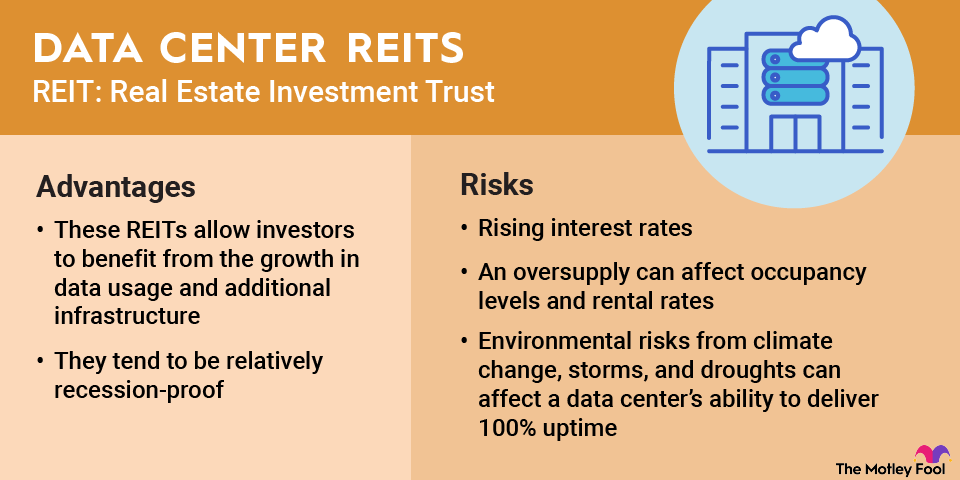
Equinix operates as a Real Estate Investment Trust (REIT), which is a specialized company that owns and manages income-producing real estate. Its platform creates a network effect where a high density of customers attracts more service providers and partners to the same locations.

A Look at the Numbers

  • Total revenue was $2.6 billion for the three months ended June 30, 2026, up 16% year over year.
  • Net income hit $477 million for the three months ended June 30, 2026, up 30% year over year.
  • Adjusted EBITDA, a non-GAAP metric, reached $2.6 billion for the six months ended June 30, 2026, up 20% year over year.
  • The company held $2.2 billion in cash, cash equivalents, and short-term investments as of June 30, 2026.

Bottom Line

Equinix has evolved from a basic data center provider into a global interconnection platform supporting cloud and artificial intelligence needs. Its focus on recurring revenue and strategic joint ventures provides a steady foundation for continued digital infrastructure expansion.

AI Generated • Aug 4, 2026

Industry

Specialized REITs

Employees

13,716

CEO

Adaire Fox-Martin

Headquarters

Redwood City, CA 94065-1562, US

EQIX Financials

Key Financial Metrics (TTM)

Gross Margin

51.60%

Operating Margin

21.76%

Net Income Margin

15.60%

Return on Equity

10.76%

Return on Capital

5.01%

Return on Assets

3.73%

Earnings Yield

1.63%

Dividend Yield

2.11%

Payout Ratio

1.28%

Stock Overview

Market Cap

$94.23BMarket cap calculated using publicly traded shares outstanding only. Does not include unlisted, private, or dual-class non-traded shares. Implied market cap may vary.

Shares Outstanding

98.67M

Volume

605.66K

Avg. Volume

551.69K

Financials (TTM)

Gross Profit

$5.07B

Operating Income

$2.14B

EBITDA

$4.49B

Operating Cash Flow

$3.94B

Capital Expenditure

-$2.57B

Free Cash Flow

$1.37B

Cash & ST Invst.

$2.22B

Total Debt

$23.36B

Equinix Performance Analysis

Equinix annual revenue and year-over-year revenue growth by fiscal year
Fiscal yearPeriod endRevenueYoY growth
20222022-12-31USD 7,264,657,0009.4%
20232023-12-31USD 8,188,136,00012.7%
20242024-12-31USD 8,748,000,0006.8%
20252025-12-31USD 9,217,000,0005.4%
Equinix sequential (quarter-over-quarter) revenue growth by fiscal quarter
Fiscal quarterPeriod endQoQ growth
Q32025-09-302.7%
Q42025-12-315.4%
Q12026-03-310.1%
Q22026-06-307.4%
Equinix annual diluted earnings per share and year-over-year EPS growth by fiscal year
Fiscal yearPeriod endDiluted EPSYoY growth
20222022-12-31USD 7.6738.6%
20232023-12-31USD 10.3134.4%
20242024-12-31USD 8.50-17.5%
20252025-12-31USD 13.7661.8%
Equinix sequential (quarter-over-quarter) diluted earnings per share growth by fiscal quarter
Fiscal quarterPeriod endQoQ growth
Q32025-09-301.6%
Q42025-12-31-29.4%
Q12026-03-3156.1%
Q22026-06-3015.0%

Revenue Growth Rate

Annual and quarterly growth comparison

Earnings Per Share Growth Rate

Annual and quarterly EPS growth comparison

Quarterly Performance

Name
Q2 2026YOY CHG

Revenue

$2.63B

+16.4%

Gross Profit

$1.40B

+19.0%

Gross Margin

53.14%

N/A

Market Cap

$94.23BMarket cap calculated using publicly traded shares outstanding only. Does not include unlisted, private, or dual-class non-traded shares. Implied market cap may vary.

N/A

Market Cap/Employee

$6.87M

N/A

Employees

13,716

N/A

Net Income

$479.00M

+30.2%

EBITDA

$1.23B

+18.5%

Quarterly Fundamentals

Name
Q2 2026YOY CHG

Total Cash

$2.22B

-50.9%

Total Debt

$23.36B

+6.9%

Accounts Receivable

$1.26B

+10.5%

Inventory

$0.00

N/A

Long Term Debt

$21.85B

+11.6%

Short Term Debt

$1.51B

-33.8%

Return on Assets

3.73%

N/A

Return on Invested Capital

5.74%

N/A

Free Cash Flow

$2.32B

+5262.2%

Operating Cash Flow

$1.07B

+13.0%

Other Investments to Explore

People Also Watch

Symbol / CompanyPricePrice Chg
VRTVertiv Holdings Co
$194.32-0.65%
DLRDigital Realty Trust, Inc.
$172.37+0.84%
ALABAstera Labs, Inc. Common Stock
$257.16-0.26%
NBISNebius Group N.V.
$158.74-0.27%

Trending Stocks

Symbol / CompanyPricePrice Chg
SPCXSpace Exploration Technologies
$147.49+1.89%
TAT&T
$20.93-7.96%
SOXLDirexion Shares ETF Trust - Direxion Daily Semiconductor Bull 3x ETF
$83.56+1.77%
NUNu Holdings
$15.16+2.92%

Questions About EQIX

What is the current price of Equinix?

Equinix is trading at $955.03 per share.

What is the 52-week range for Equinix?

Over the past 52 weeks, Equinix has traded between $720.62 and $1,128.68.

How much debt does Equinix have?

As of the most recent reporting period, Equinix reported total debt of $23.36B.

How much cash does Equinix have on hand?

Equinix reported $980.00M in cash and cash equivalents in its most recent financial results.

What is Equinix’s dividend yield?

Equinix currently has a dividend yield of 2.11%.

Premium Investing Services

Invest better with The Motley Fool. Get stock recommendations, portfolio guidance, and more from The Motley Fool's premium services.