Accessibility Menu
Village Farms International logo

Village Farms International(NASDAQ) VFF

Market Cap$331.40MMarket cap calculated using publicly traded shares outstanding only. Does not include unlisted, private, or dual-class non-traded shares. Implied market cap may vary.
Since IPO (2012)+115%
5 Year-72%
1 Year-8%
1 Month+40%
Premium Feature
Moneyball Superscore
63/100
$2.70
-0.92%
-0.02Today
After hours$2.71+$0.01 (+0.37%)
Village Farms International last closing stock price
MetricPriceDate
Last closeUSD 2.712026-08-24
Village Farms International stock price return by period
PeriodPrice returnPrice at period startPeriod start date
1 week+5.04%USD 2.582026-08-17
1 month+40.41%USD 1.932026-07-24
3 month+6.69%USD 2.542026-05-26
Year to date-25.75%USD 3.652025-12-31
1 year-8.45%USD 2.962025-08-22
3 year+257.94%USD 0.762023-08-25
5 year-71.77%USD 9.602021-08-25
Since inception+114.51%USD 1.272012-05-09

Village Farms International Financials at a Glance

Market Cap

$331.40MMarket cap calculated using publicly traded shares outstanding only. Does not include unlisted, private, or dual-class non-traded shares. Implied market cap may vary.

Revenue (TTM)

$230.57M

Net Income (TTM)

$22.71M

EPS (TTM)

$0.19

P/E Ratio

14.57

Dividend

$0.00

Beta (Volatility)

1.41 (Average)

Price

$2.70

Volume

1,115,396.574

Open

$2.72

Previous Close

$2.71

Daily Range

$2.68 - $2.82

52-Week Range

$1.81 - $4.99

Estimated Earnings Date

Nov 9, 2026

VFF: Motley Fool Moneyball Superscore

63

Our CEO Is Handing Members His Secret Weapon

It's called Motley Fool Moneyball, our new proprietary AI tool

We spent over half a million dollars in R&D to build a tool that makes stock research faster, sharper, and smarter. Our analysts use it every day, and now, you can too.

Get Access Now

About Village Farms International

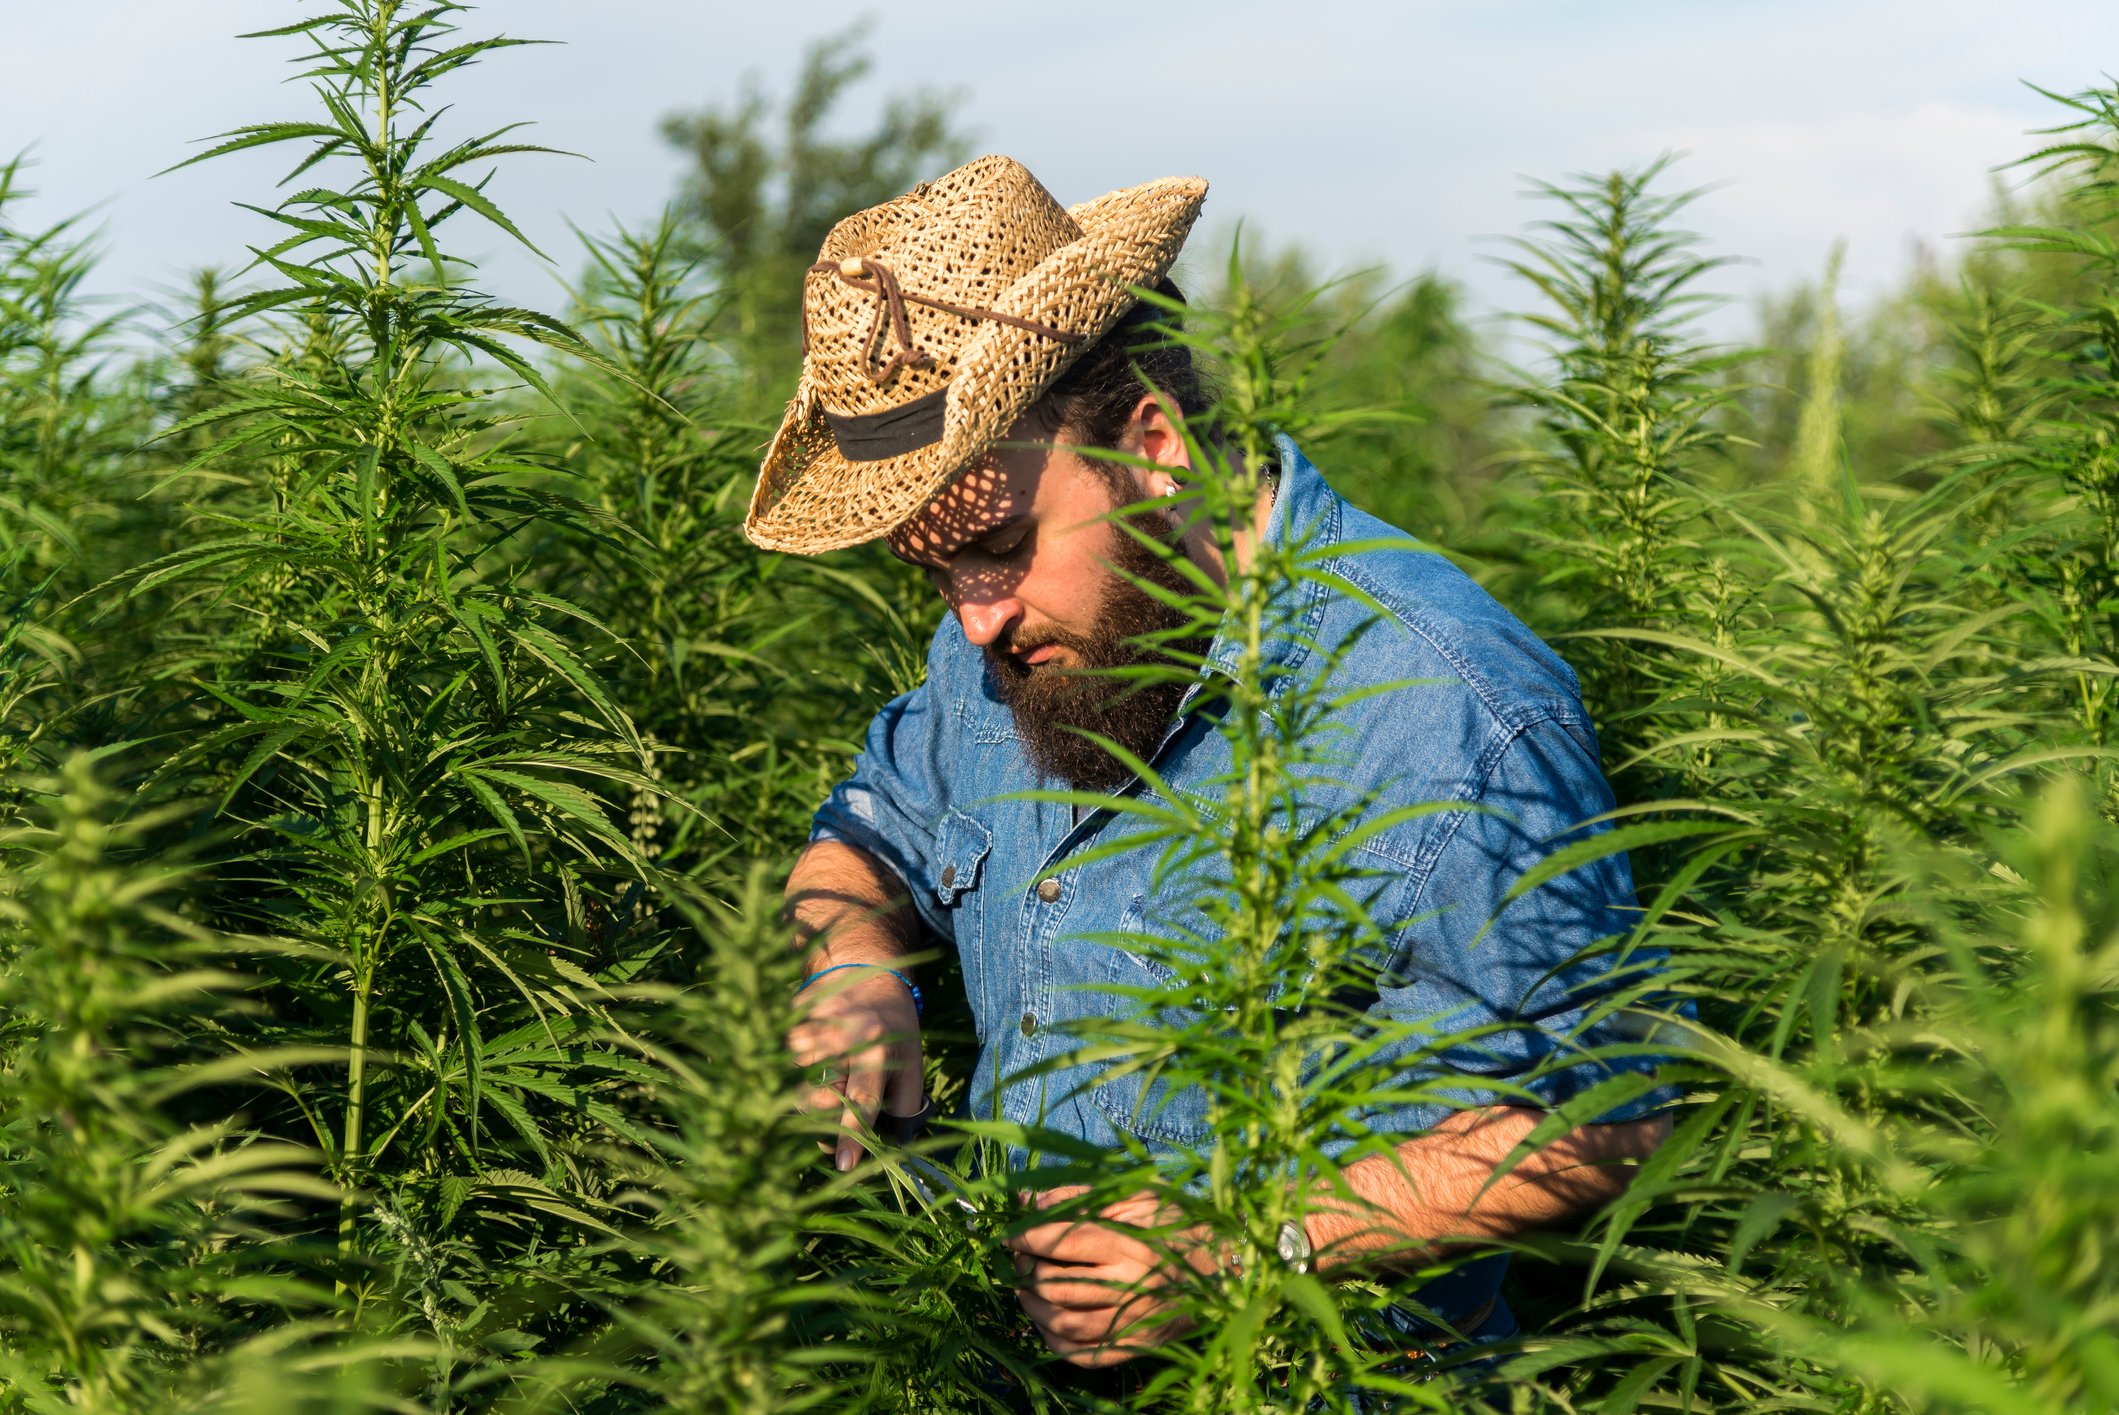
Village Farms International, Inc. grows greenhouse vegetables like tomatoes. It also produces and sells cannabis products. The company makes health items from hemp.

More Than Just Tomatoes

  • Cannabis Segment: Branded and non-branded dried flower, vapes, and pre-rolls for recreational and medical use; sales totaled $53.5 million in the three-month period ended June 30, 2026.
  • Village Farms Fresh: Greenhouse-grown tomatoes sold to retail supermarkets and fresh food distribution companies; sales totaled $10.2 million in the three-month period ended June 30, 2026.
  • Hemp and Cannabinoids: Health and wellness items like cannabidiol (CBD) oils and topicals sold through an e-commerce platform in the United States.
  • Clean Energy: Electricity and thermal heat produced for the British Columbia Hydro and Power Authority at a dedicated energy facility.

Growing Across the Globe

  • Commenced cultivation at the Phase II indoor facility in Groningen, Netherlands during the second quarter of 2026.
  • Expanded international distribution by starting cannabis product exports to New Zealand in 2025.
  • Increased its ownership interest in Quebec-based Rose LifeScience to 86.6% in May 2026.
  • Converted two large-scale British Columbia greenhouse facilities to cannabis production to serve adult-use and medical markets.

Agricultural Innovation at Scale

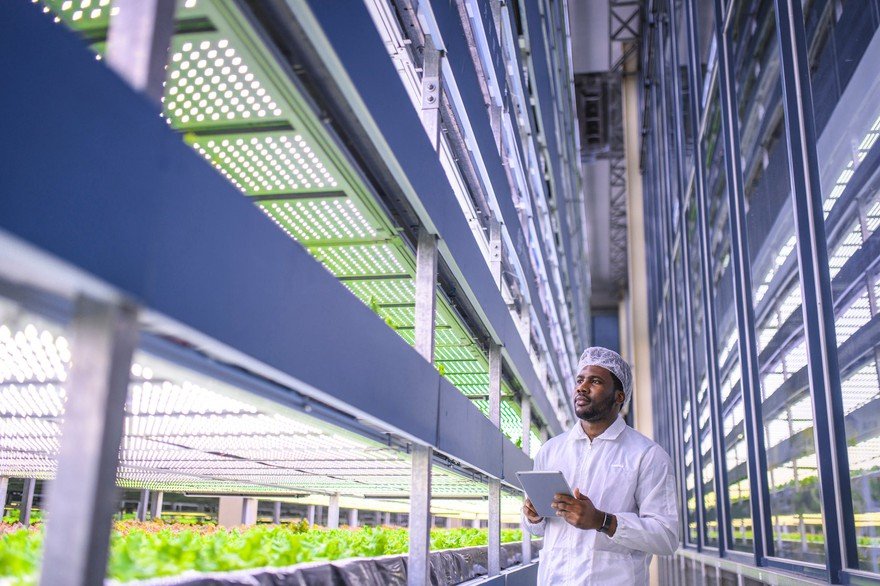
Village Farms uses controlled environment agriculture to produce crops with lower operating costs than traditional farming. Its European Union Good Manufacturing Practice (EU GMP) certification allows it to export medical cannabis to international markets that require high safety standards.

Reviewing the Financial Results

  • Total revenue was $64 million for the three-month period ended June 30, 2026, up 7% year over year.
  • International export sales reached a record $20.9 million in the three-month period ended June 30, 2026, rising 74% year over year.
  • Adjusted EBITDA from continuing operations was $25.3 million for the six-month period ended June 30, 2026.
  • Cash and cash equivalents totaled $72.9 million as of June 30, 2026.

A Shifting Business Strategy

Village Farms has transitioned its core expertise from greenhouse produce to the global legal cannabis market. The company continues to prioritize low-cost production and international expansion to drive long-term performance.

AI Generated • Aug 10, 2026

Industry

Food Products

Employees

1,128

CEO

Michael A. DeGiglio

Headquarters

Lake Mary, FL 32746, US

VFF Financials

Key Financial Metrics (TTM)

Gross Margin

44.29%

Operating Margin

16.09%

Net Income Margin

9.85%

Return on Equity

7.56%

Return on Capital

8.21%

Return on Assets

5.30%

Earnings Yield

6.86%

Dividend Yield

0.00%

Payout Ratio

0.00%

Stock Overview

Market Cap

$331.40MMarket cap calculated using publicly traded shares outstanding only. Does not include unlisted, private, or dual-class non-traded shares. Implied market cap may vary.

Shares Outstanding

122.29M

Volume

1.12M

Avg. Volume

1.05M

Financials (TTM)

Gross Profit

$102.12M

Operating Income

$37.10M

EBITDA

$49.42M

Operating Cash Flow

$26.21M

Capital Expenditure

-$28.33M

Free Cash Flow

-$2.12M

Cash & ST Invst.

$72.93M

Total Debt

$46.19M

Village Farms International Performance Analysis

Village Farms International annual revenue and year-over-year revenue growth by fiscal year
Fiscal yearPeriod endRevenueYoY growth
20222022-12-31USD 293,572,0009.5%
20232023-12-31USD 285,603,000-2.7%
20242024-12-31USD 195,907,000-31.4%
20252025-12-31USD 215,937,00010.2%
Village Farms International sequential (quarter-over-quarter) revenue growth by fiscal quarter
Fiscal quarterPeriod endQoQ growth
Q32025-09-3011.4%
Q42025-12-31-25.7%
Q12026-03-311.3%
Q22026-06-3027.3%
Village Farms International annual diluted earnings per share and year-over-year EPS growth by fiscal year
Fiscal yearPeriod endDiluted EPSYoY growth
20222022-12-31USD -1.13927.0%
20232023-12-31USD -0.32-71.8%
20242024-12-31USD -0.320.6%
20252025-12-31USD 0.11N/A
Village Farms International sequential (quarter-over-quarter) diluted earnings per share growth by fiscal quarter
Fiscal quarterPeriod endQoQ growth
Q32025-09-30-64.7%
Q42025-12-31-76.2%
Q12026-03-3113.9%
Q22026-06-30160.9%

Revenue Growth Rate

Annual and quarterly growth comparison

Earnings Per Share Growth Rate

Annual and quarterly EPS growth comparison

Quarterly Performance

Name
Q2 2026YOY CHG

Revenue

$63.98M

+6.8%

Gross Profit

$29.97M

+34.2%

Gross Margin

46.85%

N/A

Market Cap

$331.40MMarket cap calculated using publicly traded shares outstanding only. Does not include unlisted, private, or dual-class non-traded shares. Implied market cap may vary.

N/A

Market Cap/Employee

$293.79K

N/A

Employees

1,128

N/A

Net Income

$7.15M

-73.0%

EBITDA

$10.93M

-34.5%

Quarterly Fundamentals

Name
Q2 2026YOY CHG

Total Cash

$72.93M

+21.6%

Total Debt

$46.19M

+2.7%

Accounts Receivable

$33.80M

+20.5%

Inventory

$46.67M

+18.2%

Long Term Debt

$39.77M

+14.1%

Short Term Debt

$6.42M

-36.6%

Return on Assets

5.30%

N/A

Return on Invested Capital

9.82%

N/A

Free Cash Flow

$2.64M

-86.3%

Operating Cash Flow

$8.88M

-59.8%

Other Investments to Explore

People Also Watch

Symbol / CompanyPricePrice Chg
CHSCLCHS Inc.
$25.36-0.16%
ALCOAlico, Inc.
$41.22+2.26%
LNDBrasilAgro - Companhia Brasileira de Propriedades Agrícolas
$3.79+0.53%
BGSB&G Foods, Inc.
$3.49+0.87%

Trending Stocks

Symbol / CompanyPricePrice Chg
NVDANvidia
$208.48-0.03%
BITOProShares Trust - ProShares Bitcoin ETF
$10.63+0.02%
INTCIntel
$87.26-0.03%
IBITiShares Bitcoin Trust
$44.64+0.02%

Questions About VFF

What is the current price of Village Farms International?

Village Farms International is trading at $2.71 per share.

What is the 52-week range for Village Farms International?

Over the past 52 weeks, Village Farms International has traded between $1.81 and $4.99.

How much debt does Village Farms International have?

As of the most recent reporting period, Village Farms International reported total debt of $46.19M.

How much cash does Village Farms International have on hand?

Village Farms International reported $72.93M in cash and cash equivalents in its most recent financial results.

What is Village Farms International’s dividend yield?

Village Farms International does not currently have a dividend yield.

Premium Investing Services

Invest better with The Motley Fool. Get stock recommendations, portfolio guidance, and more from The Motley Fool's premium services.