Accessibility Menu
General Motors logo

General Motors(NYSE) GM

Current Price$79.86
Market Cap$68.35BMarket cap calculated using publicly traded shares outstanding only. Does not include unlisted, private, or dual-class non-traded shares. Implied market cap may vary.
Since IPO (2010)+199%
5 Year+38%
1 Year+44%
1 Month-4%
General Motors last closing stock price
MetricPriceDate
Last closeUSD 75.802026-07-20
General Motors stock price return by period
PeriodPrice returnPrice at period startPeriod start date
1 week-1.2%USD 76.722026-07-13
1 month-4.4%USD 79.292026-06-18
3 month-3.9%USD 78.882026-04-21
Year to date-6.36%USD 80.952025-12-31
1 year+43.73%USD 52.742025-07-18
3 year+102.76%USD 37.382023-07-21
5 year+38.33%USD 54.792021-07-21
Since inception+198.65%USD 25.382010-11-18

General Motors Financials at a Glance

Market Cap

$68.35BMarket cap calculated using publicly traded shares outstanding only. Does not include unlisted, private, or dual-class non-traded shares. Implied market cap may vary.

Revenue (TTM)

$185.53B

Net Income (TTM)

$1.92B

EPS (TTM)

$2.48

P/E Ratio

30.57

Dividend

$0.66

Beta (Volatility)

1.19 (Average)

Price

$79.86

Volume

326,651

Open

$75.35

Previous Close

$75.80

Daily Range

$75.00 - $80.09

52-Week Range

$48.87 - $87.62

Estimated Earnings Date

Jul 21, 2026

GM: Motley Fool Moneyball Superscore

66

Our CEO Is Handing Members His Secret Weapon

It's called Motley Fool Moneyball, our new proprietary AI tool

We spent over half a million dollars in R&D to build a tool that makes stock research faster, sharper, and smarter. Our analysts use it every day, and now, you can too.

Get Access Now

About General Motors

General Motors makes trucks, cars, and SUVs for drivers around the world. The company helps people get where they need to go using traditional engines and battery power. It also provides loans to help customers buy their vehicles through a dedicated finance branch.

What General Motors Builds

  • GM North America: Designs and builds vehicles under the Buick, Cadillac, Chevrolet, and GMC brands for the U.S., Canada, and Mexico; represents 86.8% of wholesale vehicle sales in 2025.
  • GM International: Manages automotive operations across the Asia Pacific, Middle East, Africa, and South America; accounts for 13.2% of wholesale vehicle sales in 2025.
  • GM Financial: Provides retail lending, leasing, and commercial financing for dealers to stock inventory and improve facilities.
  • Software and Services: Offers OnStar safety features, connected navigation, and Super Cruise, which is a hands-free driver assistance technology for compatible roads.

Recent Strategic Shifts

  • Completed the acquisition of Cruise noncontrolling interests in February 2025 to combine autonomous technology efforts within the main business.
  • Announced plans in 2025 to invest $4 billion in U.S. manufacturing plants located in Tennessee, Kansas, and Michigan.
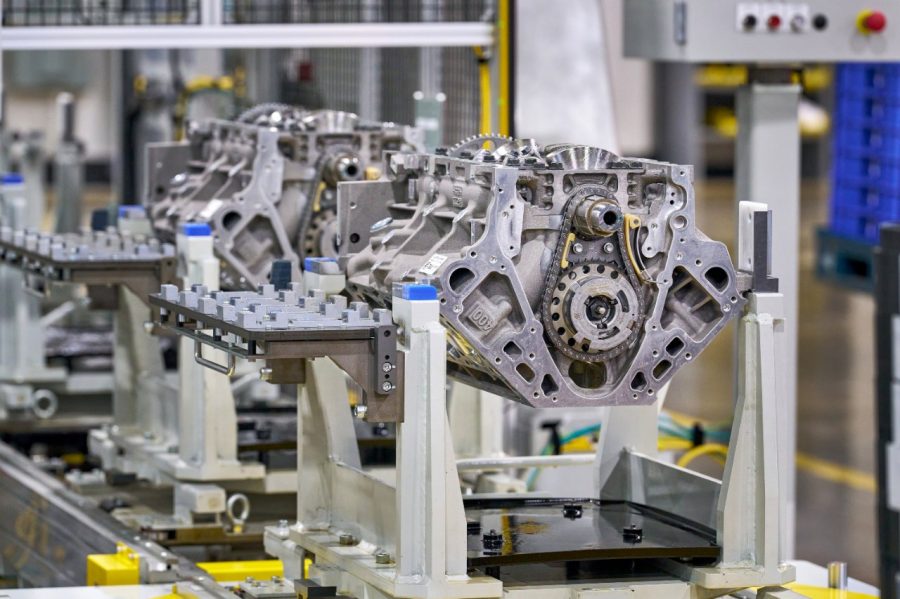
  • Committed nearly $1 billion to build a new generation of fuel-efficient V8 engines at a facility in New York.
  • Partnered with LG Energy Solution through the Ultium Cells joint venture to produce battery cells in Ohio and Tennessee.

The GM Edge

General Motors maintains a network of 50 manufacturing and parts facilities across 19 U.S. states to support its massive scale. The company uses its high-margin internal combustion trucks and SUVs to fund the development of new electric vehicle platforms and software services.

By the Numbers

  • Revenue reached $45.3 billion in Q4 2025, down 5.1% from the $47.7 billion reported in Q4 2024.
  • Operating income fell to a loss of $3.6 billion in Q4 2025, down 339.6% year-over-year.
  • Free cash flow hit $5.7 billion in Q4 2025, up 281.4% from a loss of $3.1 billion in Q4 2024.
  • Net income was a loss of $3.3 billion in Q4 2025, down 11.8% from the $3.0 billion loss in Q4 2024.
  • The company recorded $7.9 billion in charges during 2025 to realign its electric vehicle capacity with slowing consumer demand.

Bottom Line

General Motors is transitioning from a traditional automaker into a company focused on electric vehicles and software-integrated services. Its ability to leverage legacy truck profits while restructuring its global footprint defines its current business path.

AI Generated • Apr 18, 2026

Industry

Automobiles

Employees

155,000

CEO

Mary Teresa Barra, MBA

Website

www.gm.com

Headquarters

Detroit, MI 48265, US

GM Financials

Key Financial Metrics (TTM)

Gross Margin

6.10%

Operating Margin

1.34%

Net Income Margin

1.38%

Return on Equity

3.96%

Return on Capital

1.52%

Return on Assets

0.90%

Earnings Yield

3.27%

Dividend Yield

0.87%

Payout Ratio

27.76%

Stock Overview

Market Cap

$68.35BMarket cap calculated using publicly traded shares outstanding only. Does not include unlisted, private, or dual-class non-traded shares. Implied market cap may vary.

Shares Outstanding

901.66M

Volume

326.65K

Avg. Volume

7.72M

Financials (TTM)

Gross Profit

$10.64B

Operating Income

$1.81B

EBITDA

$13.21B

Operating Cash Flow

$23.20B

Capital Expenditure

-$6.70B

Free Cash Flow

$16.50B

Cash & ST Invst.

$24.72B

Total Debt

$37.01B

General Motors Performance Analysis

General Motors annual revenue and year-over-year revenue growth by fiscal year
Fiscal yearPeriod endRevenueYoY growth
20222022-12-31USD 156,735,000,00023.4%
20232023-12-31USD 171,842,000,0009.6%
20242024-12-31USD 187,442,000,0009.1%
20252025-12-31USD 185,019,000,000-1.3%
General Motors sequential (quarter-over-quarter) revenue growth by fiscal quarter
Fiscal quarterPeriod endQoQ growth
Q32025-09-303.1%
Q42025-12-31-6.8%
Q12026-03-31-3.7%
Q22026-06-3010.1%
General Motors annual diluted earnings per share and year-over-year EPS growth by fiscal year
Fiscal yearPeriod endDiluted EPSYoY growth
20222022-12-31USD 6.13-8.5%
20232023-12-31USD 7.3219.4%
20242024-12-31USD 6.37-13.0%
20252025-12-31USD 3.27-48.7%
General Motors sequential (quarter-over-quarter) diluted earnings per share growth by fiscal quarter
Fiscal quarterPeriod endQoQ growth
Q32025-09-30-29.3%
Q42025-12-31-366.7%
Q12026-03-31178.9%
Q22026-06-30-200.0%

Revenue Growth Rate

Annual and quarterly growth comparison

Earnings Per Share Growth Rate

Annual and quarterly EPS growth comparison

Quarterly Performance

Name
Q2 2026YOY CHG

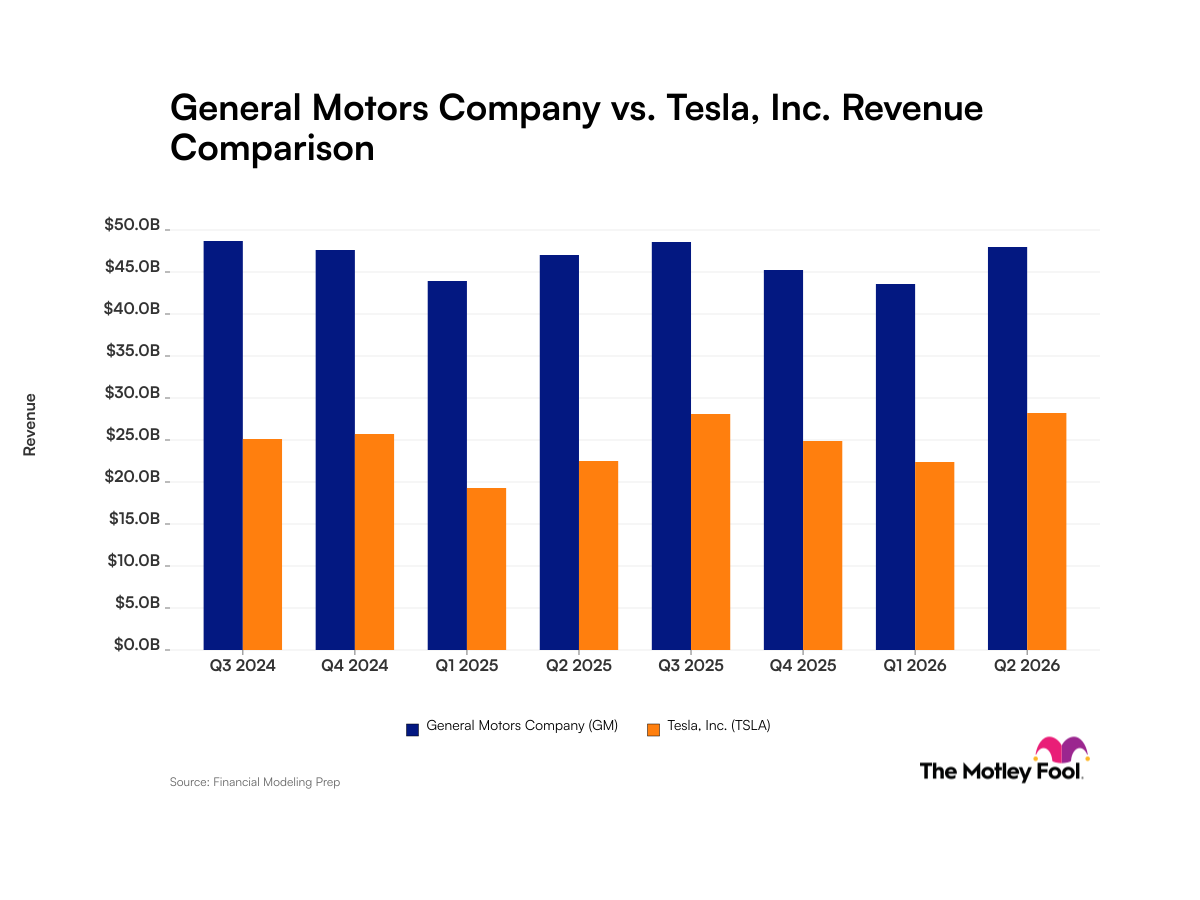
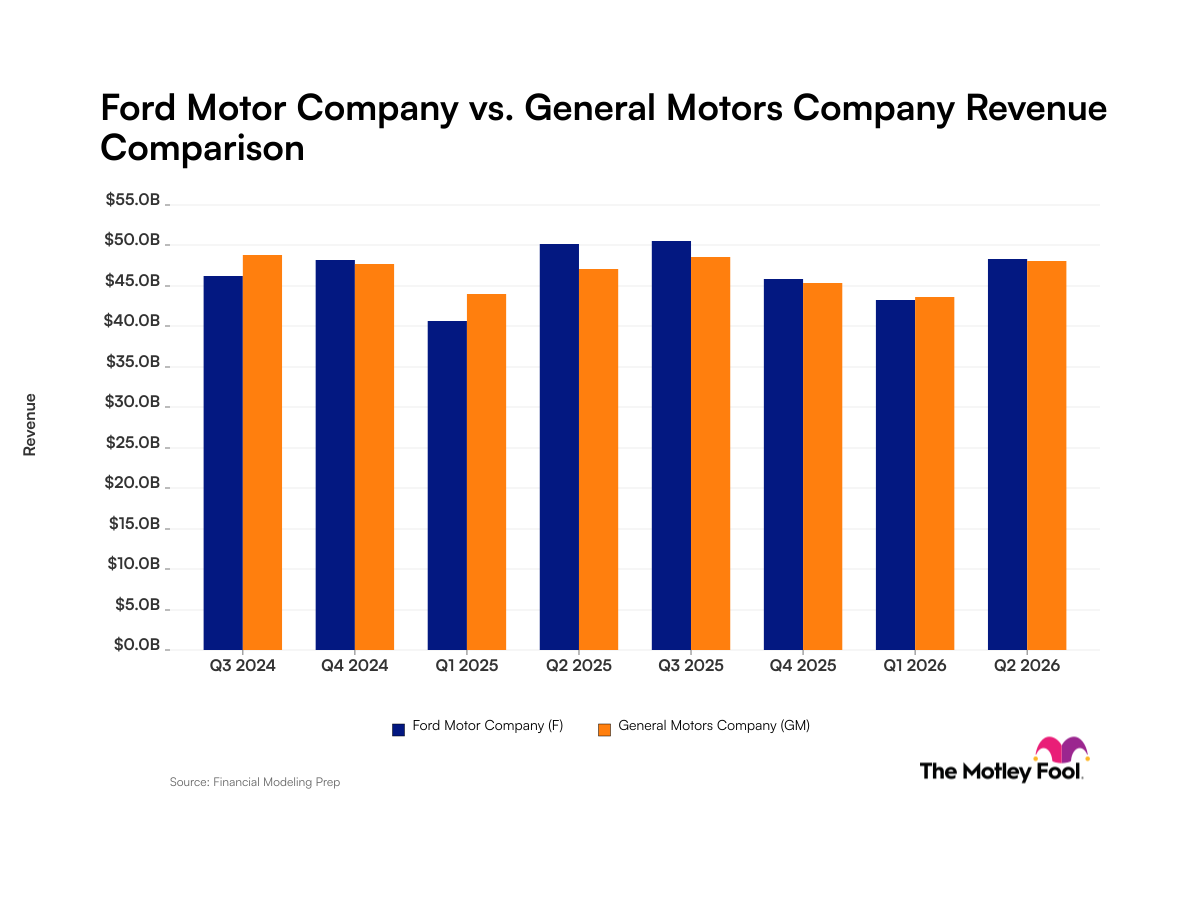
Revenue

$48.03B

+1.9%

Gross Profit

$3.66B

-14.3%

Gross Margin

-10.40%

N/A

Market Cap

$68.35BMarket cap calculated using publicly traded shares outstanding only. Does not include unlisted, private, or dual-class non-traded shares. Implied market cap may vary.

N/A

Market Cap/Employee

$440.94K

N/A

Employees

155,000

N/A

Net Income

$1.27B

-32.8%

EBITDA

$3.37B

-40.0%

Quarterly Fundamentals

Name
Q2 2026YOY CHG

Total Cash

$24.72B

-15.7%

Total Debt

$37.01B

-72.7%

Accounts Receivable

$16.77B

-72.6%

Inventory

$15.95B

+3.2%

Long Term Debt

$0.00

-100.0%

Short Term Debt

$37.01B

-3.4%

Return on Assets

0.90%

N/A

Return on Invested Capital

1.33%

N/A

Free Cash Flow

$4.41B

+1025.5%

Operating Cash Flow

$6.35B

-8.0%

Other Investments to Explore

People Also Watch

Symbol / CompanyPricePrice Chg
RACEFerrari N.V.
$370.97-0.15%
ORLYO'Reilly Automotive, Inc.
$87.87+3.95%
HLTHilton Worldwide Holdings Inc.
$326.29+0.88%
RCLRoyal Caribbean Cruises Ltd.
$288.47+0.81%

Trending Stocks

Symbol / CompanyPricePrice Chg
UTZUtz Brands
$14.11+0.89%
AALAmerican Airlines Group
$15.32+0.01%
JOBYJoby Aviation
$7.72+0.03%
MARAMara Holdings
$12.66+0.08%

Questions About GM

What is the current price of General Motors?

General Motors is trading at $79.83 per share.

What is the 52-week range for General Motors?

Over the past 52 weeks, General Motors has traded between $48.87 and $87.62.

How much debt does General Motors have?

As of the most recent reporting period, General Motors reported total debt of $127.76B.

How much cash does General Motors have on hand?

General Motors reported $23.63B in cash and cash equivalents in its most recent financial results.

What is General Motors’s dividend yield?

General Motors currently has a dividend yield of 0.87%.

Premium Investing Services

Invest better with The Motley Fool. Get stock recommendations, portfolio guidance, and more from The Motley Fool's premium services.