Accessibility Menu
Phreesia logo

Phreesia(NYSE) PHR

Market Cap$671.28MMarket cap calculated using publicly traded shares outstanding only. Does not include unlisted, private, or dual-class non-traded shares. Implied market cap may vary.
Since IPO (2019)-57%
5 Year-84%
1 Year-60%
1 Month+8%
$11.16
+2.76%
+0.30Today
Phreesia last closing stock price
MetricPriceDate
Last closeUSD 10.862026-07-28
Phreesia stock price return by period
PeriodPrice returnPrice at period startPeriod start date
1 week+2.45%USD 10.602026-07-21
1 month+7.85%USD 10.072026-06-26
3 month+15.9%USD 9.372026-04-29
Year to date-35.82%USD 16.922025-12-31
1 year-59.97%USD 27.132025-07-28
3 year-64.66%USD 30.732023-07-28
5 year-84.42%USD 69.722021-07-29
Since inception-56.7%USD 25.082019-07-18

Phreesia Financials at a Glance

Market Cap

$671.28MMarket cap calculated using publicly traded shares outstanding only. Does not include unlisted, private, or dual-class non-traded shares. Implied market cap may vary.

Revenue (TTM)

$495.59M

Net Income (TTM)

$9.18M

EPS (TTM)

$0.15

P/E Ratio

72.98

Dividend

$0.00

Beta (Volatility)

1.50 (High)

Price

$11.16

Volume

586,489.819

Open

$10.87

Previous Close

$11.14

Daily Range

$10.81 - $11.23

52-Week Range

$7.77 - $32.76

Estimated Earnings Date

Sep 3, 2026

PHR: Motley Fool Moneyball Superscore

62

Our CEO Is Handing Members His Secret Weapon

It's called Motley Fool Moneyball, our new proprietary AI tool

We spent over half a million dollars in R&D to build a tool that makes stock research faster, sharper, and smarter. Our analysts use it every day, and now, you can too.

Get Access Now

About Phreesia

Phreesia helps patients find doctors and pay for their medical visits online. It speeds up and simplifies the check-in process for everyone at the doctor’s office. Its software handles everything from scheduling appointments to checking insurance.

Tools for Modern Healthcare

  • Subscription and Related Services: Software tools that help medical offices manage patient check-ins, insurance verification, and clinical data collection.
  • Payment Solutions: Systems that let patients pay medical bills using mobile devices or kiosks; includes financing options through the AccessOne acquisition.
  • Network Solutions: Targeted health information and educational content delivered to patients during the digital intake process.
  • Clinical Support: Tools that collect patient-reported data for roughly 25 medical specialties and enable surveys and health campaigns.

Strategic Moves and Partnerships

  • Acquired AccessOne in November 2025 to expand healthcare payment and financing options for patients and providers.
  • Purchased Insignia Health, which provides the Patient Activation Measure tool to track and improve patient health engagement.
  • Acquired MediFind, an online directory that helps patients find specialized healthcare providers and care discovery tools.
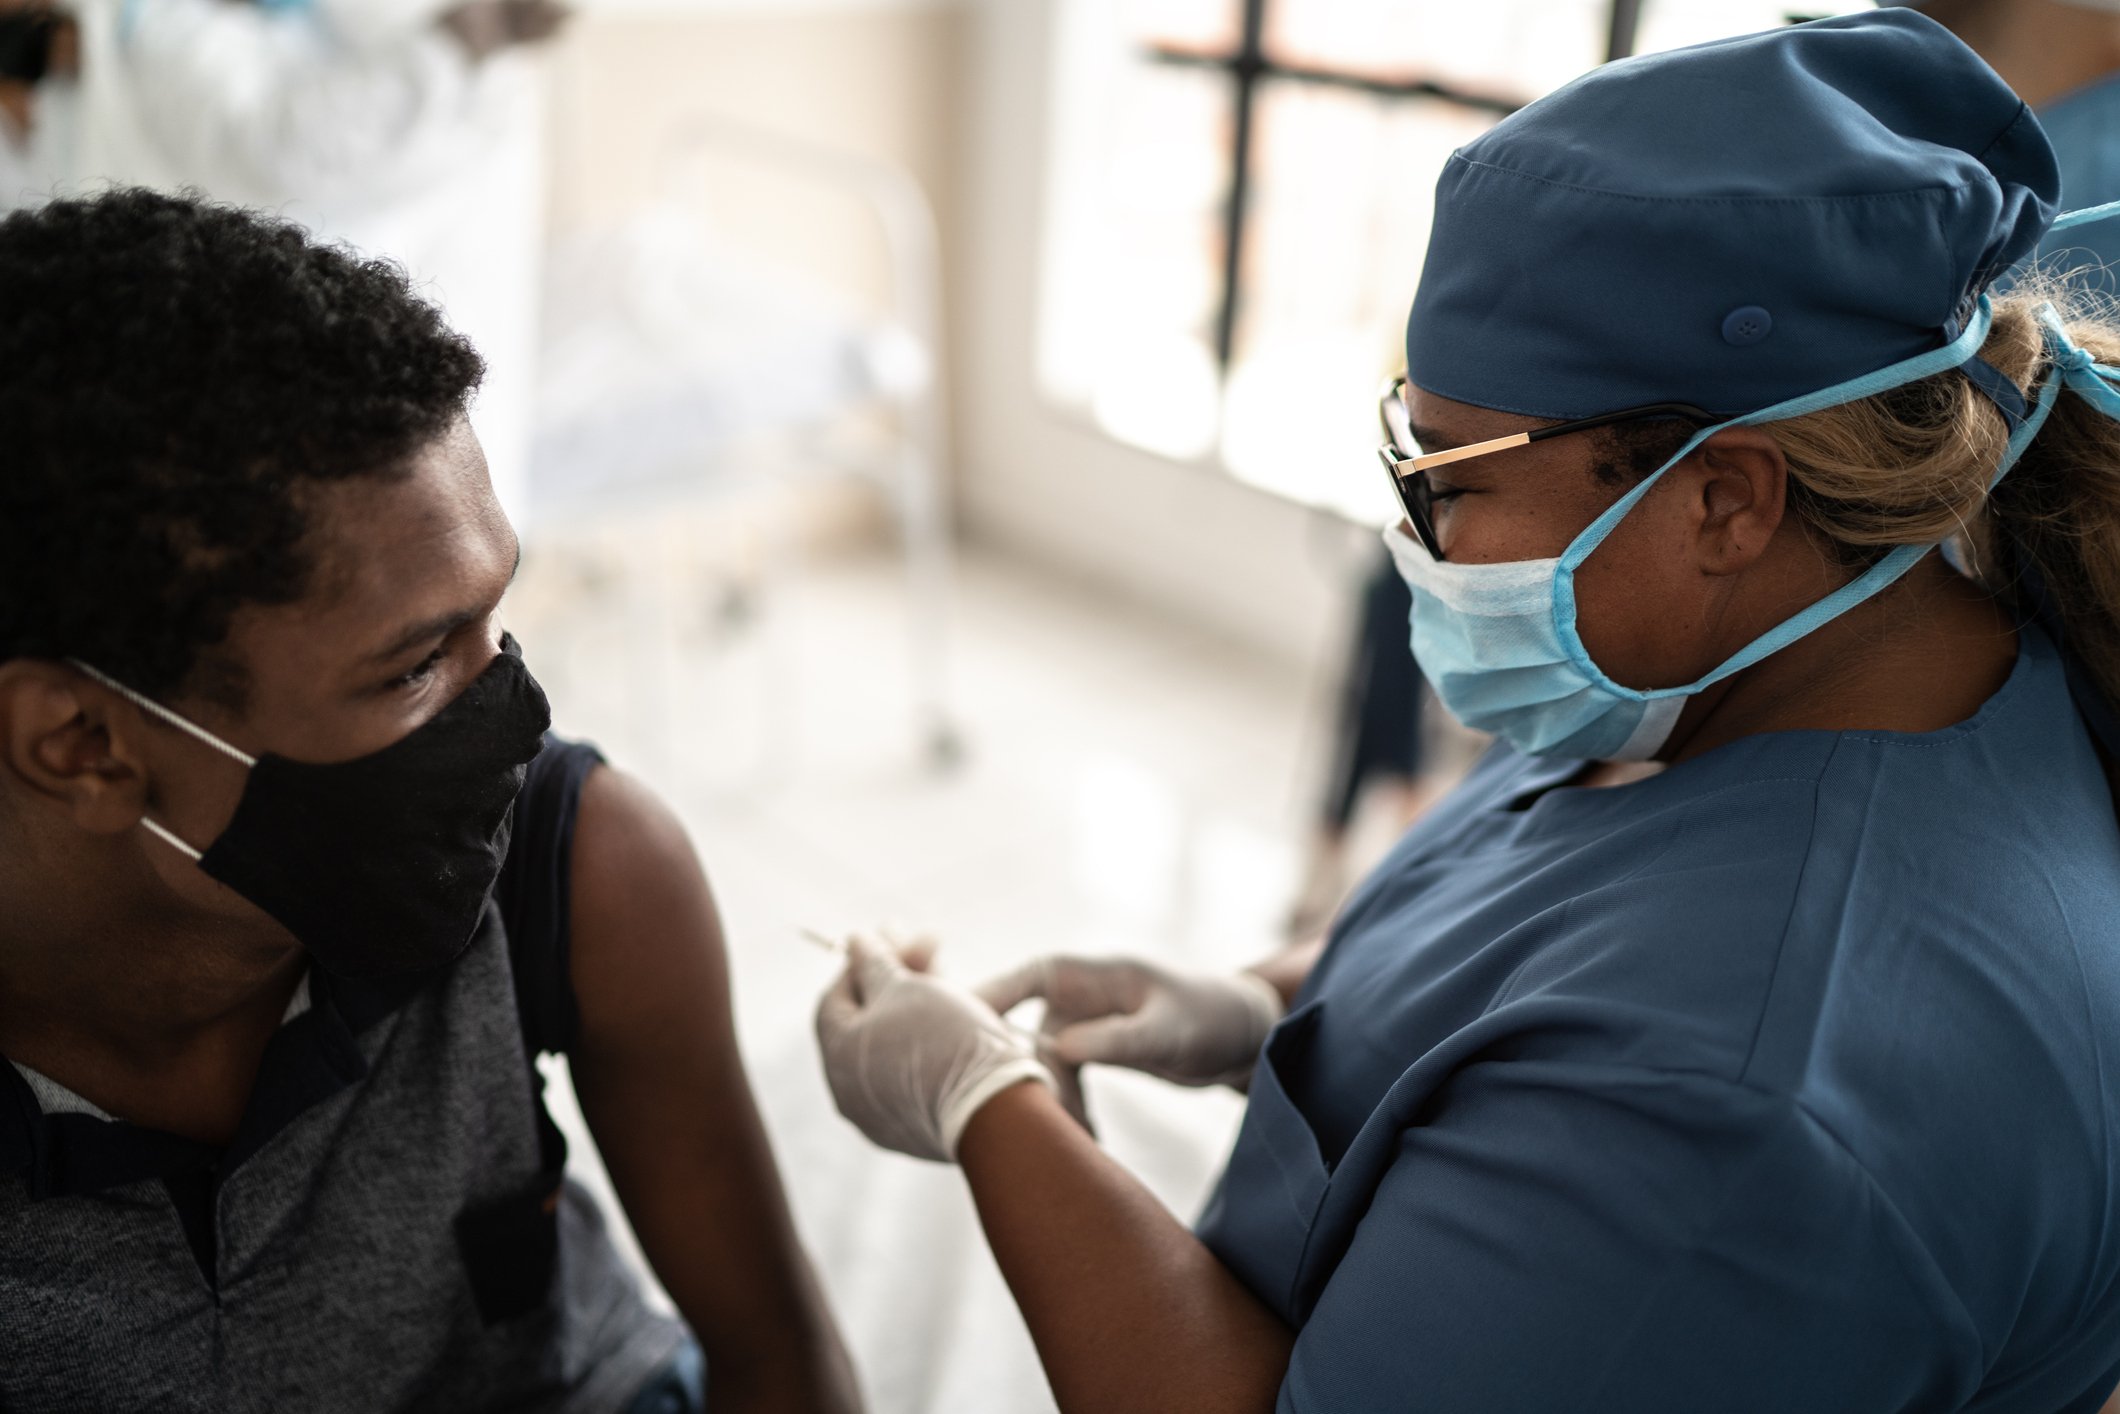
  • Developed COVID-19 support modules to manage vaccine delivery, screen for risk factors, and enable contactless check-in during visits.

Why the Platform Stands Out

Phreesia operates as a fully remote company while supporting thousands of healthcare facilities across the United States and Canada. Its platform integrates directly with electronic health records and practice management systems to automate complex administrative tasks.

The Financial Scorecard

  • Revenue reached $130.9 million in Q1 2027, up 12.9% from $115.9 million in Q1 2026.
  • Net income turned positive at $3 million in Q1 2027, an improvement from a loss of $3.3 million in Q1 2026.
  • Free cash flow hit $16.4 million in Q1 2027, up 118% from $7.5 million in the prior year.
  • Operating cash flow rose to $23.9 million in Q1 2027, a 60.4% increase compared to Q1 2026.

Bottom Line

Phreesia has transitioned from a simple patient check-in tool to a comprehensive platform for healthcare access and payments. By focusing on operational efficiency and strategic acquisitions, the company has moved toward profitability while expanding its role in the medical industry.

AI Generated • Jun 1, 2026

Industry

Health Care Technology

Employees

1,789

CEO

Chaim Indig

Headquarters

Wilmington, DE 19803, US

PHR Financials

Key Financial Metrics (TTM)

Gross Margin

65.81%

Operating Margin

0.73%

Net Income Margin

1.85%

Return on Equity

2.79%

Return on Capital

-1.50%

Return on Assets

1.38%

Earnings Yield

1.37%

Dividend Yield

0.00%

Payout Ratio

0.00%

Stock Overview

Market Cap

$671.28MMarket cap calculated using publicly traded shares outstanding only. Does not include unlisted, private, or dual-class non-traded shares. Implied market cap may vary.

Shares Outstanding

61.81M

Volume

586.49K

Avg. Volume

1.26M

Financials (TTM)

Gross Profit

$326.13M

Operating Income

$3.64M

EBITDA

$42.42M

Operating Cash Flow

$87.89M

Capital Expenditure

-$15.15M

Free Cash Flow

$72.74M

Cash & ST Invst.

$74.71M

Total Debt

$92.56M

Phreesia Performance Analysis

Phreesia annual revenue and year-over-year revenue growth by fiscal year
Fiscal yearPeriod endRevenueYoY growth
20232023-01-31USD 280,910,00031.7%
20242024-01-31USD 356,299,00026.8%
20252025-01-31USD 419,813,00017.8%
20262026-01-31USD 480,591,00014.5%
Phreesia sequential (quarter-over-quarter) revenue growth by fiscal quarter
Fiscal quarterPeriod endQoQ growth
Q22025-07-311.1%
Q32025-10-312.6%
Q42026-01-315.6%
Q12026-04-303.0%
Phreesia annual diluted earnings per share and year-over-year EPS growth by fiscal year
Fiscal yearPeriod endDiluted EPSYoY growth
20232023-01-31USD -3.3641.8%
20242024-01-31USD -2.51-25.3%
20252025-01-31USD -1.02-59.5%
20262026-01-31USD 0.04N/A
Phreesia sequential (quarter-over-quarter) diluted earnings per share growth by fiscal quarter
Fiscal quarterPeriod endQoQ growth
Q22025-07-31116.0%
Q32025-10-31554.7%
Q42026-01-31-69.6%
Q12026-04-30126.5%

Revenue Growth Rate

Annual and quarterly growth comparison

Earnings Per Share Growth Rate

Annual and quarterly EPS growth comparison

Quarterly Performance

Name
Q1 2027YOY CHG

Revenue

$130.94M

+12.9%

Gross Profit

$77.53M

-0.4%

Gross Margin

59.21%

N/A

Market Cap

$671.28MMarket cap calculated using publicly traded shares outstanding only. Does not include unlisted, private, or dual-class non-traded shares. Implied market cap may vary.

N/A

Market Cap/Employee

$375.22K

N/A

Employees

1,789

N/A

Net Income

$2.96M

+175.7%

EBITDA

$17.09M

+313.4%

Quarterly Fundamentals

Name
Q1 2027YOY CHG

Total Cash

$74.71M

-17.8%

Total Debt

$92.56M

+483.3%

Accounts Receivable

$143.31M

+32.6%

Inventory

$0.00

N/A

Long Term Debt

$86.19M

+1213.3%

Short Term Debt

$6.36M

-31.6%

Return on Assets

1.38%

N/A

Return on Invested Capital

0.71%

N/A

Free Cash Flow

$16.37M

+119.5%

Operating Cash Flow

$23.92M

+61.1%

Other Investments to Explore

People Also Watch

Symbol / CompanyPricePrice Chg
GDRXGoodRx Holdings, Inc.
$3.22+3.21%
SDGRSchrödinger, Inc.
$15.12-1.11%
OMDAOmada Health
$19.61-4.01%
KMTSKestra Medical Technologies, Ltd.
$22.75-4.65%

Trending Stocks

Symbol / CompanyPricePrice Chg
NOKNokia
$8.41-0.06%
TAT&T
$23.94-0.03%
SMRNuScale Power
$7.59-0.08%
ORCLOracle
$117.74-0.02%

Questions About PHR

What is the current price of Phreesia?

Phreesia is trading at $11.14 per share.

What is the 52-week range for Phreesia?

Over the past 52 weeks, Phreesia has traded between $7.77 and $32.76.

How much debt does Phreesia have?

As of the most recent reporting period, Phreesia reported total debt of $92.56M.

How much cash does Phreesia have on hand?

Phreesia reported $74.71M in cash and cash equivalents in its most recent financial results.

What is Phreesia’s dividend yield?

Phreesia does not currently have a dividend yield.

Premium Investing Services

Invest better with The Motley Fool. Get stock recommendations, portfolio guidance, and more from The Motley Fool's premium services.