Accessibility Menu
Utz Brands logo

Utz Brands(NYSE) UTZ

Market Cap$1.25BMarket cap calculated using publicly traded shares outstanding only. Does not include unlisted, private, or dual-class non-traded shares. Implied market cap may vary.
Since IPO (2018)+62%
5 Year-14%
1 Year+12%
1 Month+90%
$14.17
+0.14%
+0.02Today
Utz Brands last closing stock price
MetricPriceDate
Last closeUSD 14.152026-08-19
Utz Brands stock price return by period
PeriodPrice returnPrice at period startPeriod start date
1 week+0.14%USD 14.132026-08-12
1 month+89.93%USD 7.452026-07-20
3 month+85.42%USD 7.632026-05-21
Year to date+38.71%USD 10.202025-12-31
1 year+12.31%USD 12.602025-08-19
3 year+0.29%USD 14.112023-08-18
5 year-14.2%USD 16.492021-08-20
Since inception+62.1%USD 8.732018-11-26

Utz Brands Financials at a Glance

Market Cap

$1.25BMarket cap calculated using publicly traded shares outstanding only. Does not include unlisted, private, or dual-class non-traded shares. Implied market cap may vary.

Revenue (TTM)

$1.45B

Net Income (TTM)

-$29.00M

EPS (TTM)

-$0.33

P/E Ratio

-42.75

Dividend

$0.25

Beta (Volatility)

0.54 (Low)

Price

$14.17

Volume

32,847.673

Open

$14.18

Previous Close

$14.15

Daily Range

$14.15 - $14.19

52-Week Range

$6.78 - $14.19

Estimated Earnings Date

Oct 29, 2026

UTZ: Motley Fool Moneyball Superscore

47

Our CEO Is Handing Members His Secret Weapon

It's called Motley Fool Moneyball, our new proprietary AI tool

We spent over half a million dollars in R&D to build a tool that makes stock research faster, sharper, and smarter. Our analysts use it every day, and now, you can too.

Get Access Now

About Utz Brands

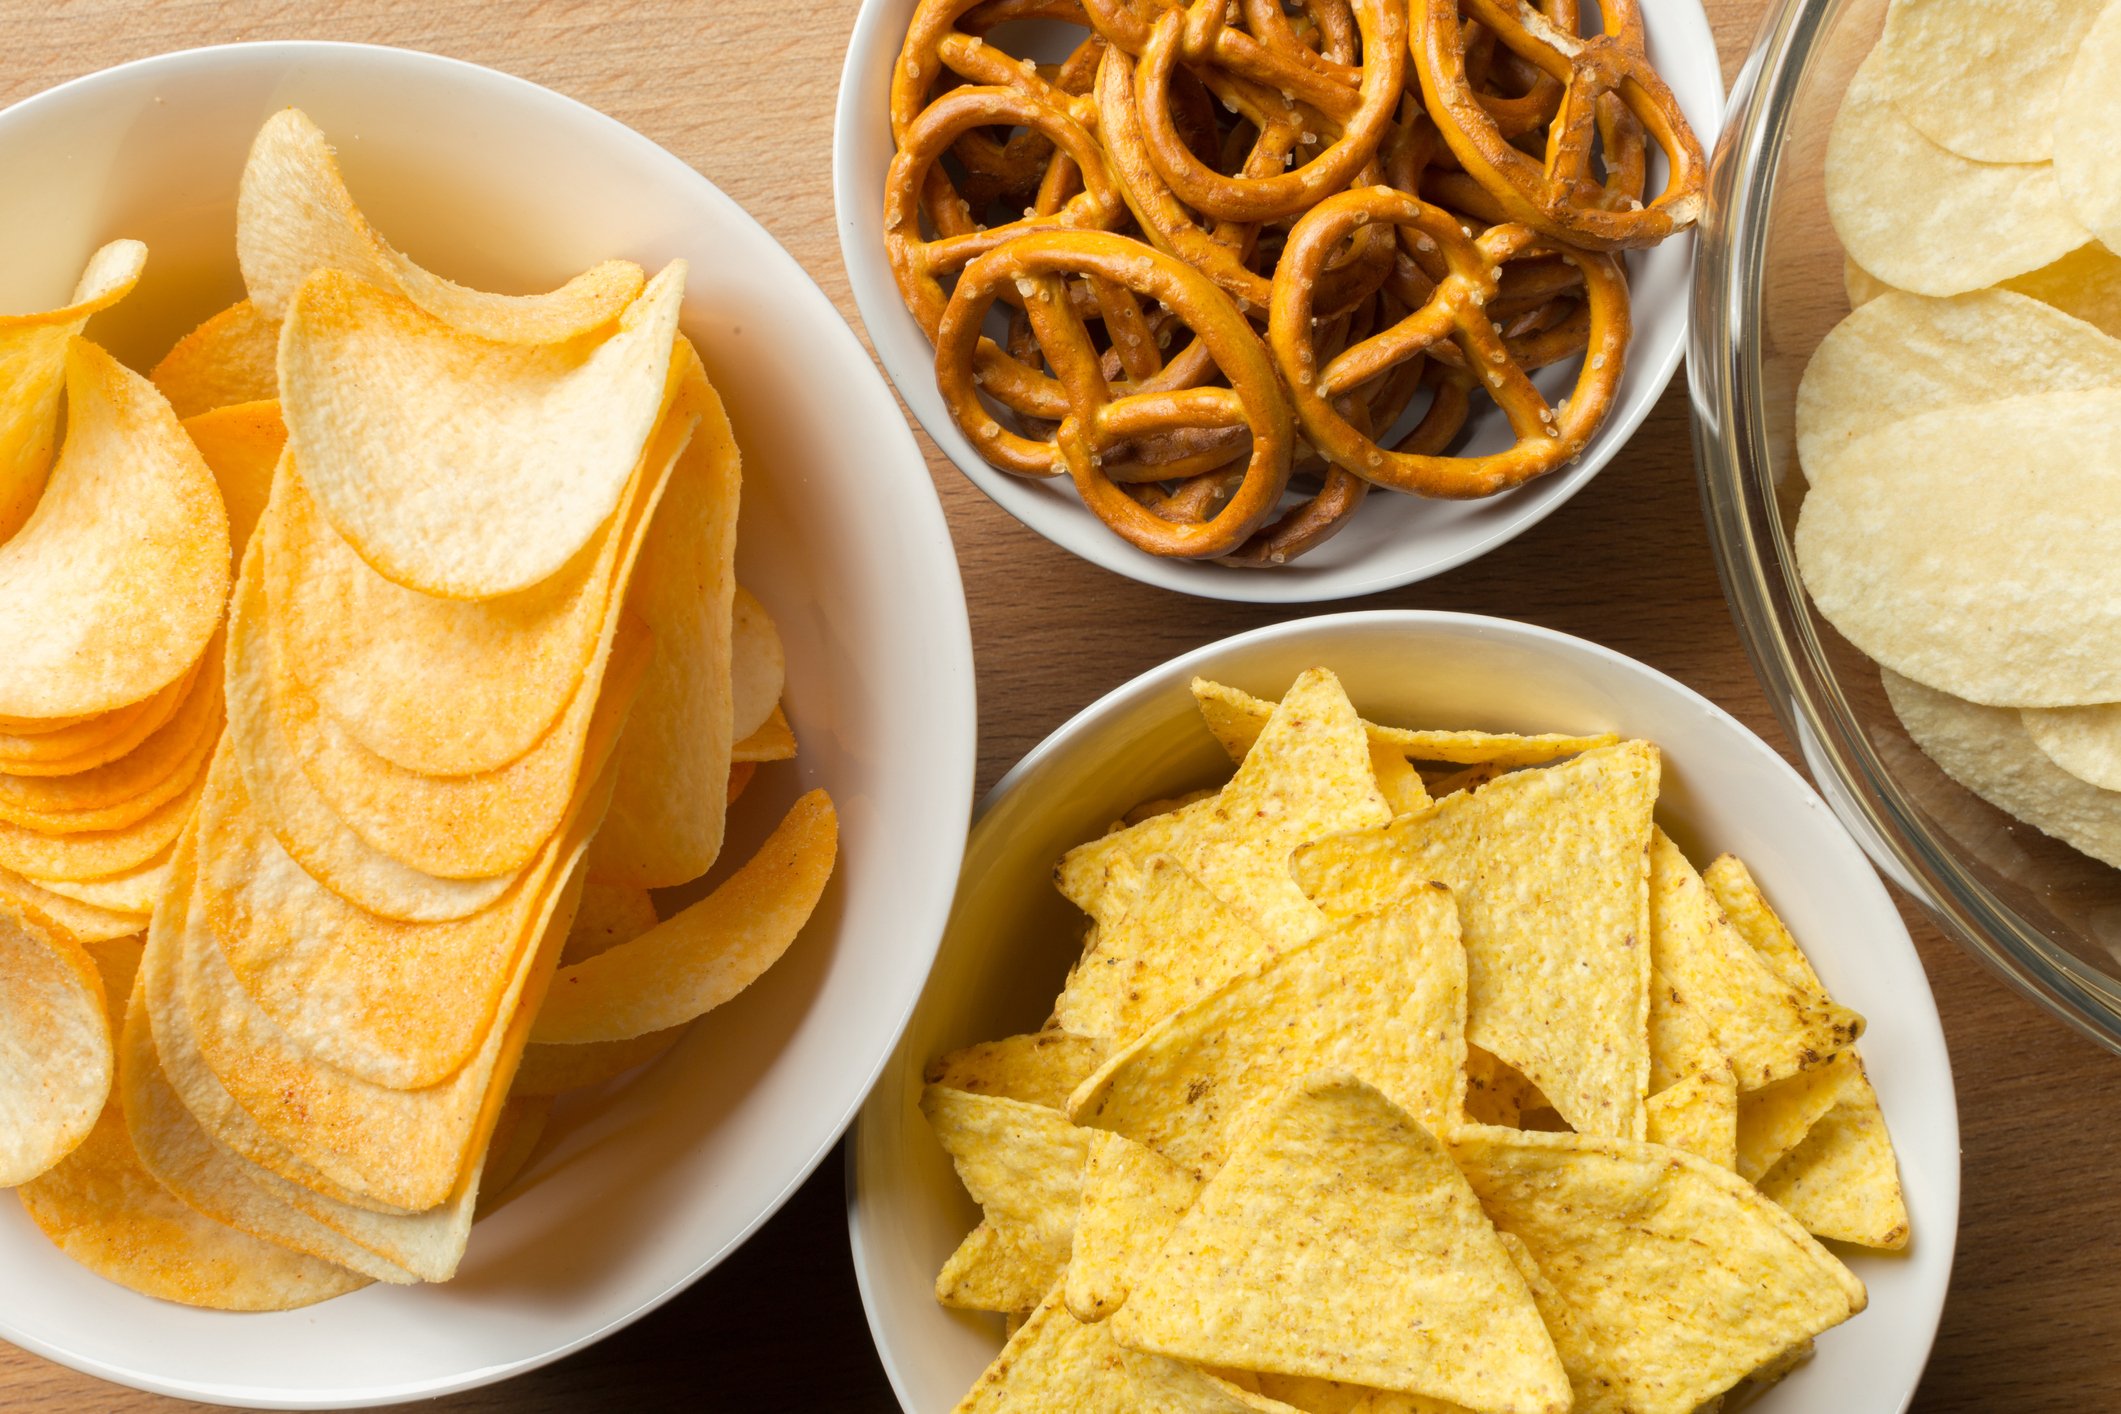
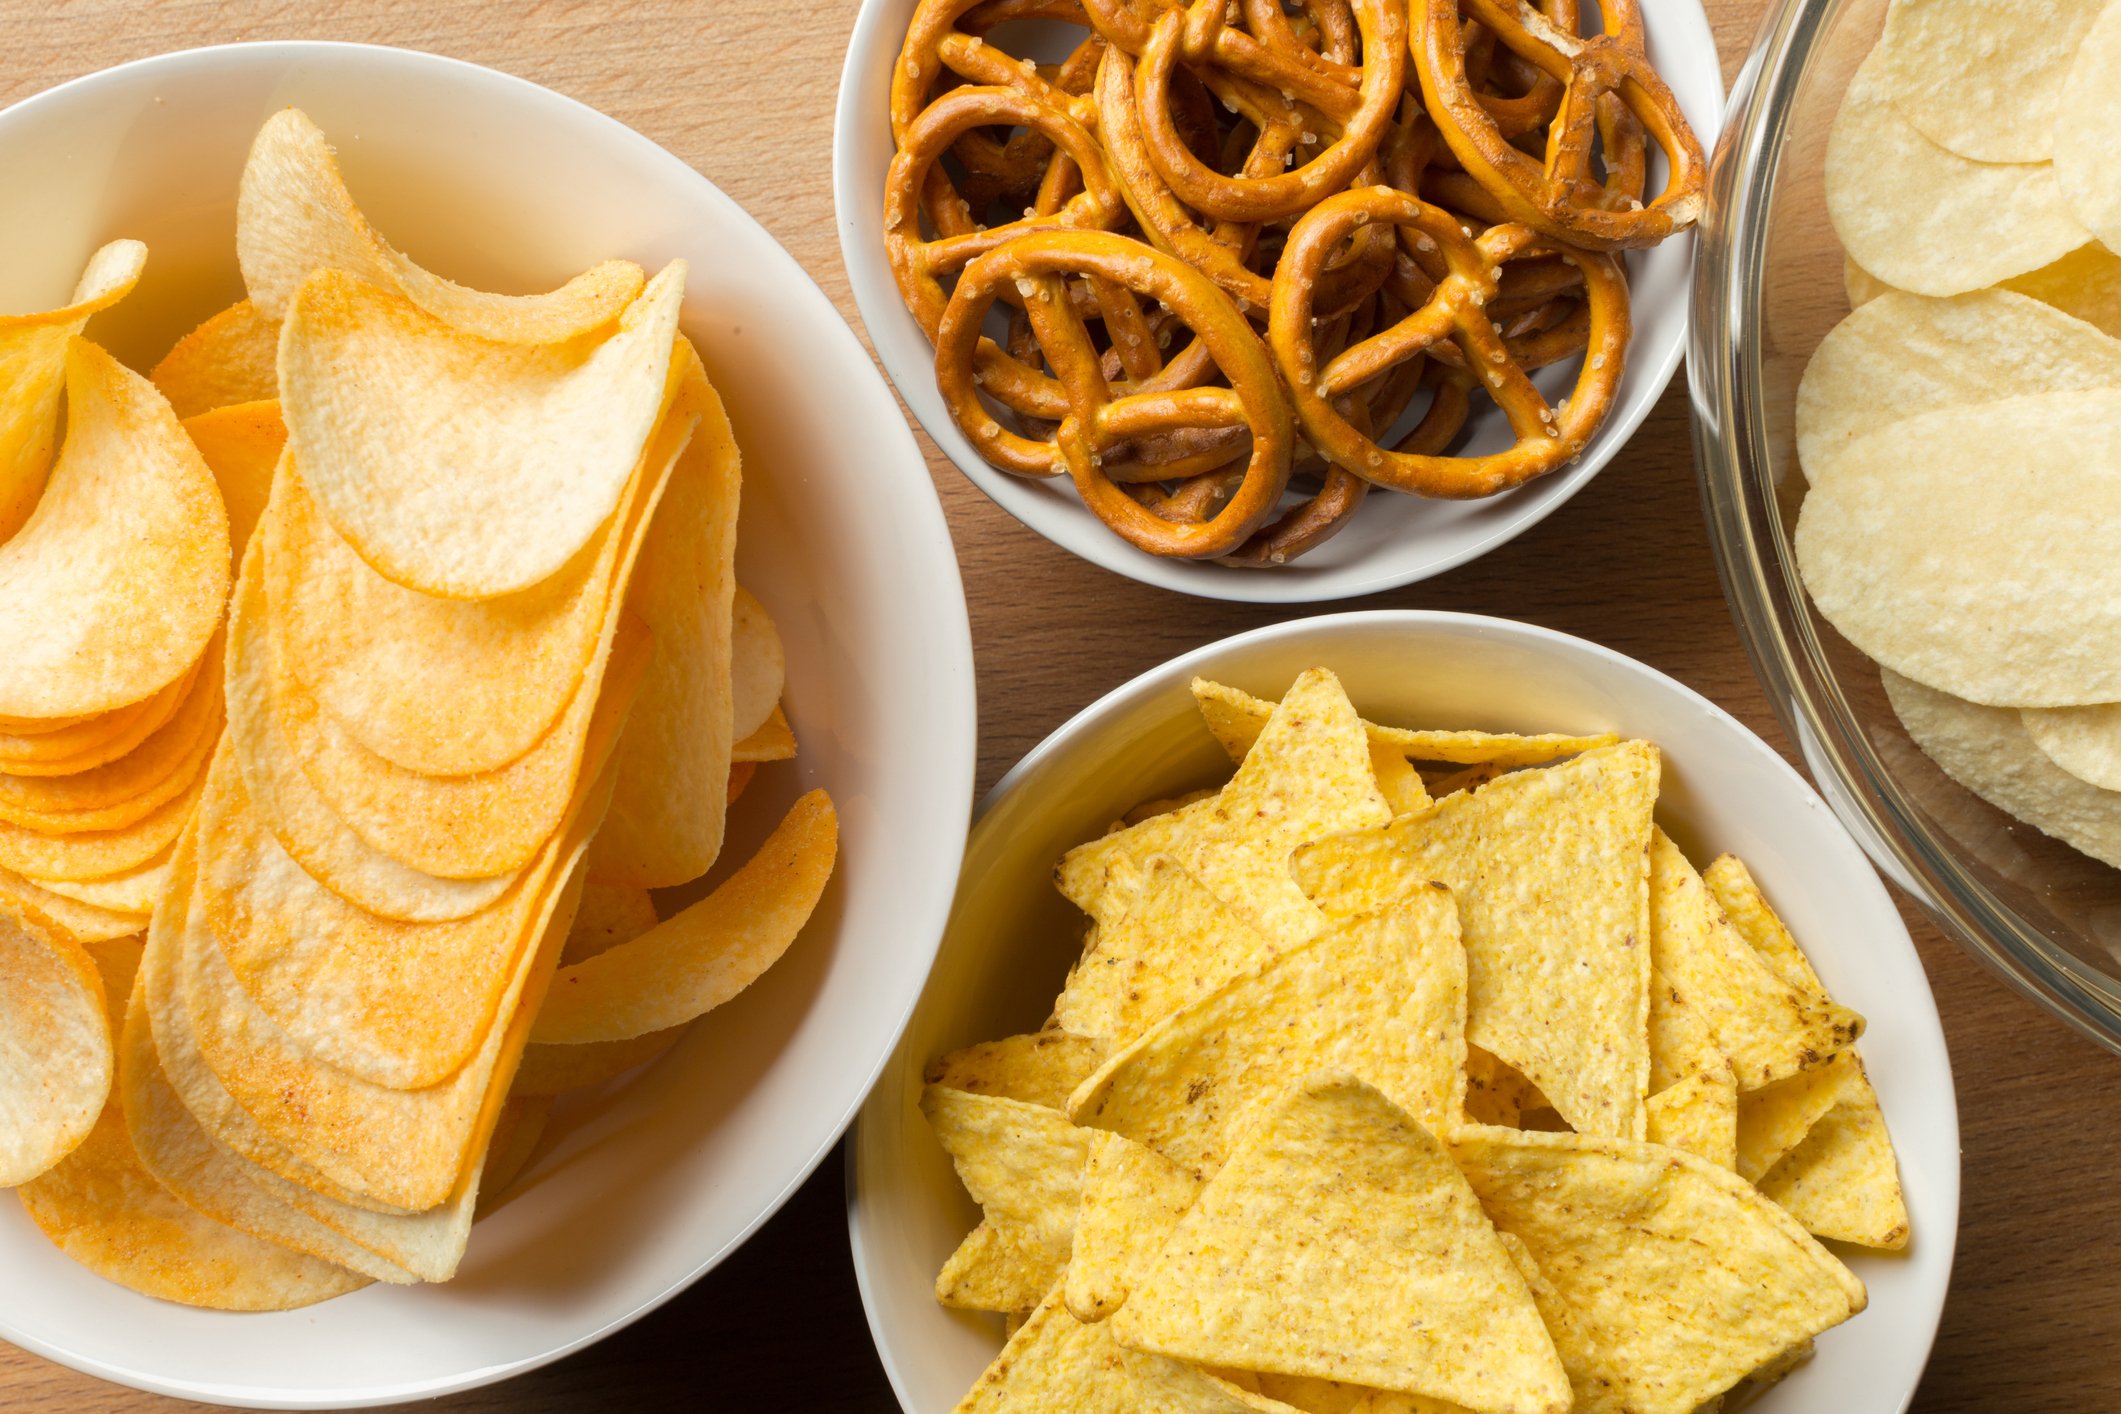
Utz Brands makes snacks for people who want salty treats. Products help families find easy snacks for parties and homes. The company sells chips, pretzels, and dips across the country.

What is in the Bag?

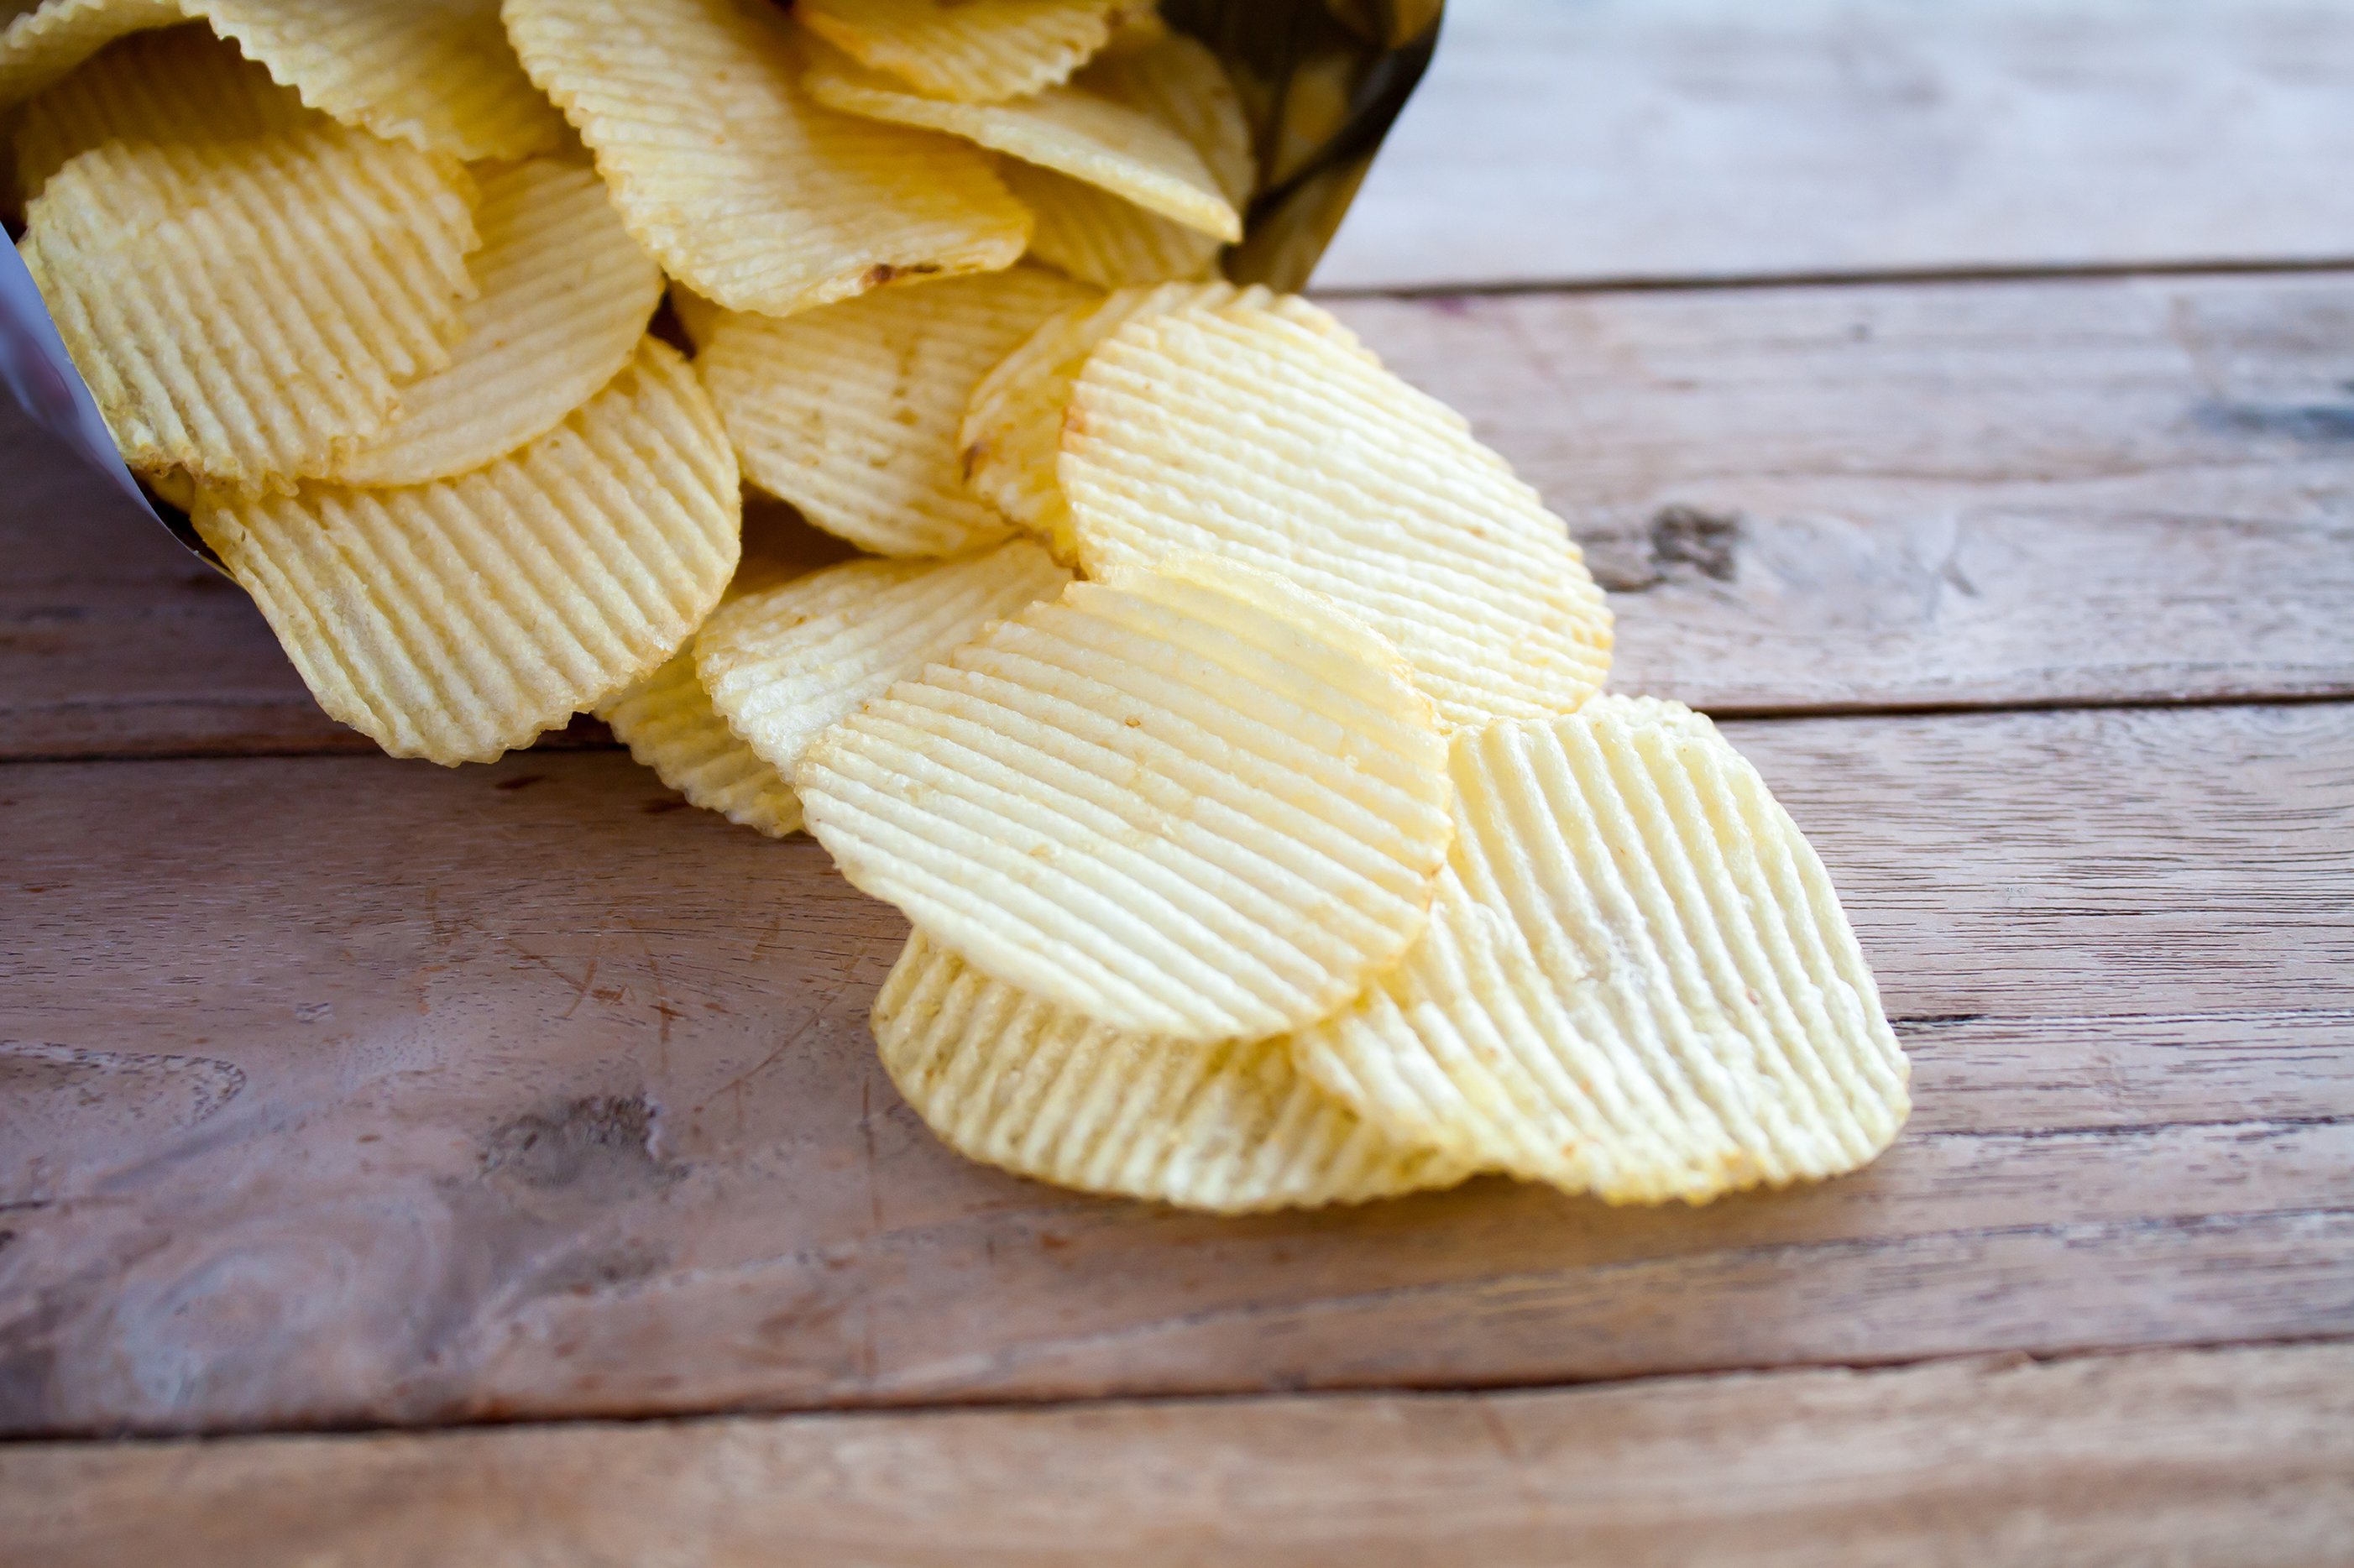
  • Branded Salty Snacks: Potato chips, pretzels, and tortilla chips; represented 89% of net sales in the thirteen weeks ended June 28, 2026.
  • Non-Branded and Non-Salty: Partner brands, private label products, and co-manufacturing services; represented 11% of net sales in the thirteen weeks ended June 28, 2026.
  • Power Four Brands: Core growth labels including Utz, On The Border, Zapp's, and Boulder Canyon.
  • Better-for-You Options: Snacks made with avocado and olive oils for consumers seeking alternative cooking ingredients.

Expanding the Reach

  • Entered a definitive agreement on July 20, 2026, for Intersnack Group to acquire the company for $14.25 per share in cash.
  • Acquired direct-store delivery distribution assets from Insignia International in October 2025 to accelerate growth in California.
  • Strategic decision in July 2025 to close the Grand Rapids manufacturing facility to optimize the supply chain network.
  • Launched a multi-phase project in September 2025 to modernize and upgrade facilities at the Hanover, Pennsylvania campus.

Why Utz Stands Out

Utz operates a direct-store delivery network of about 2,500 routes that ship products directly to retail shelves for better merchandising. The company sources nearly all its ingredients within the United States, which limits its exposure to international trade tariffs and global pricing changes.

Key Financial Figures

  • Net sales reached $371.8 million in the thirteen weeks ended June 28, 2026, up 1.4% year over year.
  • Selling, general, and administrative expenses increased 15.1% to $101.3 million during the thirteen weeks ended June 28, 2026.
  • Net loss was $18.4 million for the twenty-six weeks ended June 28, 2026, compared to a net income of $15.8 million in the prior year period.
  • Variable rate debt totaled $685.1 million as of June 28, 2026.
  • Non-GAAP adjusted EBITDA, which excludes certain non-cash costs and transformation expenses, was $55.7 million for the thirteen weeks ended June 28, 2026.

Bottom Line

Utz has evolved from a regional producer into a national snack competitor through strategic acquisitions and supply chain transformations. Its pending acquisition by Intersnack Group marks a major transition into private ownership after more than a century of operations.

AI Generated • Aug 5, 2026

Industry

Food Products

Employees

3,300

CEO

Howard A. Friedman, MBA

Headquarters

Hanover, PA 17331, US

UTZ Financials

Key Financial Metrics (TTM)

Gross Margin

20.12%

Operating Margin

-5.21%

Net Income Margin

-2.00%

Return on Equity

-4.08%

Return on Capital

5.24%

Return on Assets

-1.04%

Earnings Yield

-2.34%

Dividend Yield

1.77%

Payout Ratio

-77.59%

Stock Overview

Market Cap

$1.25BMarket cap calculated using publicly traded shares outstanding only. Does not include unlisted, private, or dual-class non-traded shares. Implied market cap may vary.

Shares Outstanding

88.61M

Volume

32.85K

Avg. Volume

3.43M

Financials (TTM)

Gross Profit

$292.40M

Operating Income

-$75.70M

EBITDA

$98.20M

Operating Cash Flow

$115.60M

Capital Expenditure

-$64.50M

Free Cash Flow

$51.10M

Cash & ST Invst.

$58.60M

Total Debt

$1.03B

Utz Brands Performance Analysis

Utz Brands annual revenue and year-over-year revenue growth by fiscal year
Fiscal yearPeriod endRevenueYoY growth
20222022-12-31USD 1,408,401,00019.3%
20232023-12-31USD 1,438,237,0002.1%
20242024-12-31USD 1,409,200,000-2.0%
20252025-12-31USD 1,438,800,0002.1%
Utz Brands sequential (quarter-over-quarter) revenue growth by fiscal quarter
Fiscal quarterPeriod endQoQ growth
Q32025-09-283.0%
Q42025-12-28-9.4%
Q12026-03-295.6%
Q22026-06-282.9%
Utz Brands annual diluted earnings per share and year-over-year EPS growth by fiscal year
Fiscal yearPeriod endDiluted EPSYoY growth
20222022-12-31USD -0.00N/A
20232023-12-31USD -0.316177.6%
20242024-12-31USD 0.19N/A
20252025-12-31USD 0.01-95.1%
Utz Brands sequential (quarter-over-quarter) diluted earnings per share growth by fiscal quarter
Fiscal quarterPeriod endQoQ growth
Q32025-09-28-241.7%
Q42025-12-2883.2%
Q12026-03-2932.9%
Q22026-06-28-472.9%

Revenue Growth Rate

Annual and quarterly growth comparison

Earnings Per Share Growth Rate

Annual and quarterly EPS growth comparison

Quarterly Performance

Name
Q2 2026YOY CHG

Revenue

$371.80M

+1.4%

Gross Profit

$96.20M

-24.1%

Gross Margin

25.87%

N/A

Market Cap

$1.25BMarket cap calculated using publicly traded shares outstanding only. Does not include unlisted, private, or dual-class non-traded shares. Implied market cap may vary.

N/A

Market Cap/Employee

$391.84K

N/A

Employees

3,200

N/A

Net Income

-$10.10M

-196.2%

EBITDA

$17.40M

-55.7%

Quarterly Fundamentals

Name
Q2 2026YOY CHG

Total Cash

$58.60M

+7.3%

Total Debt

$1.03B

-2.2%

Accounts Receivable

$127.70M

-23.3%

Inventory

$128.70M

+2.5%

Long Term Debt

$964.60M

-4.0%

Short Term Debt

$65.90M

+35.0%

Return on Assets

-1.04%

N/A

Return on Invested Capital

-3.11%

N/A

Free Cash Flow

-$1.90M

+82.1%

Operating Cash Flow

$11.70M

-28.3%

Other Investments to Explore

People Also Watch

Symbol / CompanyPricePrice Chg
HLFHerbalife Nutrition Ltd.
$12.25-1.61%
THSTreeHouse Foods, Inc.
$24.43-0.08%
EPCEdgewell Personal Care Company
$27.83-3.17%
SENEASeneca Foods Corporation
$190.11-1.10%

Trending Stocks

Symbol / CompanyPricePrice Chg
WBSWebster Financial
$77.57-0.01%
IBITiShares Bitcoin Trust
$38.78+0.06%
SOXSDirexion Shares ETF Trust - Direxion Daily Semiconductor Bear 3x ETF
$47.05+0.06%
MRNAModerna
$174.38+1.77%

Questions About UTZ

What is the current price of Utz Brands?

Utz Brands is trading at $14.15 per share.

What is the 52-week range for Utz Brands?

Over the past 52 weeks, Utz Brands has traded between $6.78 and $14.19.

How much debt does Utz Brands have?

As of the most recent reporting period, Utz Brands reported total debt of $1.03B.

How much cash does Utz Brands have on hand?

Utz Brands reported $58.60M in cash and cash equivalents in its most recent financial results.

What is Utz Brands’s dividend yield?

Utz Brands currently has a dividend yield of 1.77%.

Premium Investing Services

Invest better with The Motley Fool. Get stock recommendations, portfolio guidance, and more from The Motley Fool's premium services.