Accessibility Menu
Utz Brands logo

Utz Brands(NYSE) UTZ

Current Price$14.07
Market Cap$1.24BMarket cap calculated using publicly traded shares outstanding only. Does not include unlisted, private, or dual-class non-traded shares. Implied market cap may vary.
Since IPO (2018)+61%
5 Year-34%
1 Year+3%
1 Month+101%
Utz Brands last closing stock price
MetricPriceDate
Last closeUSD 14.062026-07-21
Utz Brands stock price return by period
PeriodPrice returnPrice at period startPeriod start date
1 week+87.97%USD 7.482026-07-14
1 month+101.23%USD 6.992026-06-18
3 month+86.67%USD 7.532026-04-22
Year to date+37.82%USD 10.202025-12-31
1 year+3.09%USD 13.642025-07-21
3 year-12.17%USD 16.012023-07-21
5 year-33.61%USD 21.182021-07-22
Since inception+61.07%USD 8.732018-11-26

Utz Brands Financials at a Glance

Market Cap

$1.24BMarket cap calculated using publicly traded shares outstanding only. Does not include unlisted, private, or dual-class non-traded shares. Implied market cap may vary.

Revenue (TTM)

$1.45B

Net Income (TTM)

-$8.40M

EPS (TTM)

-$0.10

P/E Ratio

-144.80

Dividend

$0.25

Beta (Volatility)

0.54 (Low)

Price

$14.07

Volume

428,661

Open

$14.10

Previous Close

$14.07

Daily Range

$14.06 - $14.11

52-Week Range

$6.78 - $14.53

Estimated Earnings Date

Jul 30, 2026

UTZ: Motley Fool Moneyball Superscore

47

Our CEO Is Handing Members His Secret Weapon

It's called Motley Fool Moneyball, our new proprietary AI tool

We spent over half a million dollars in R&D to build a tool that makes stock research faster, sharper, and smarter. Our analysts use it every day, and now, you can too.

Get Access Now

About Utz Brands

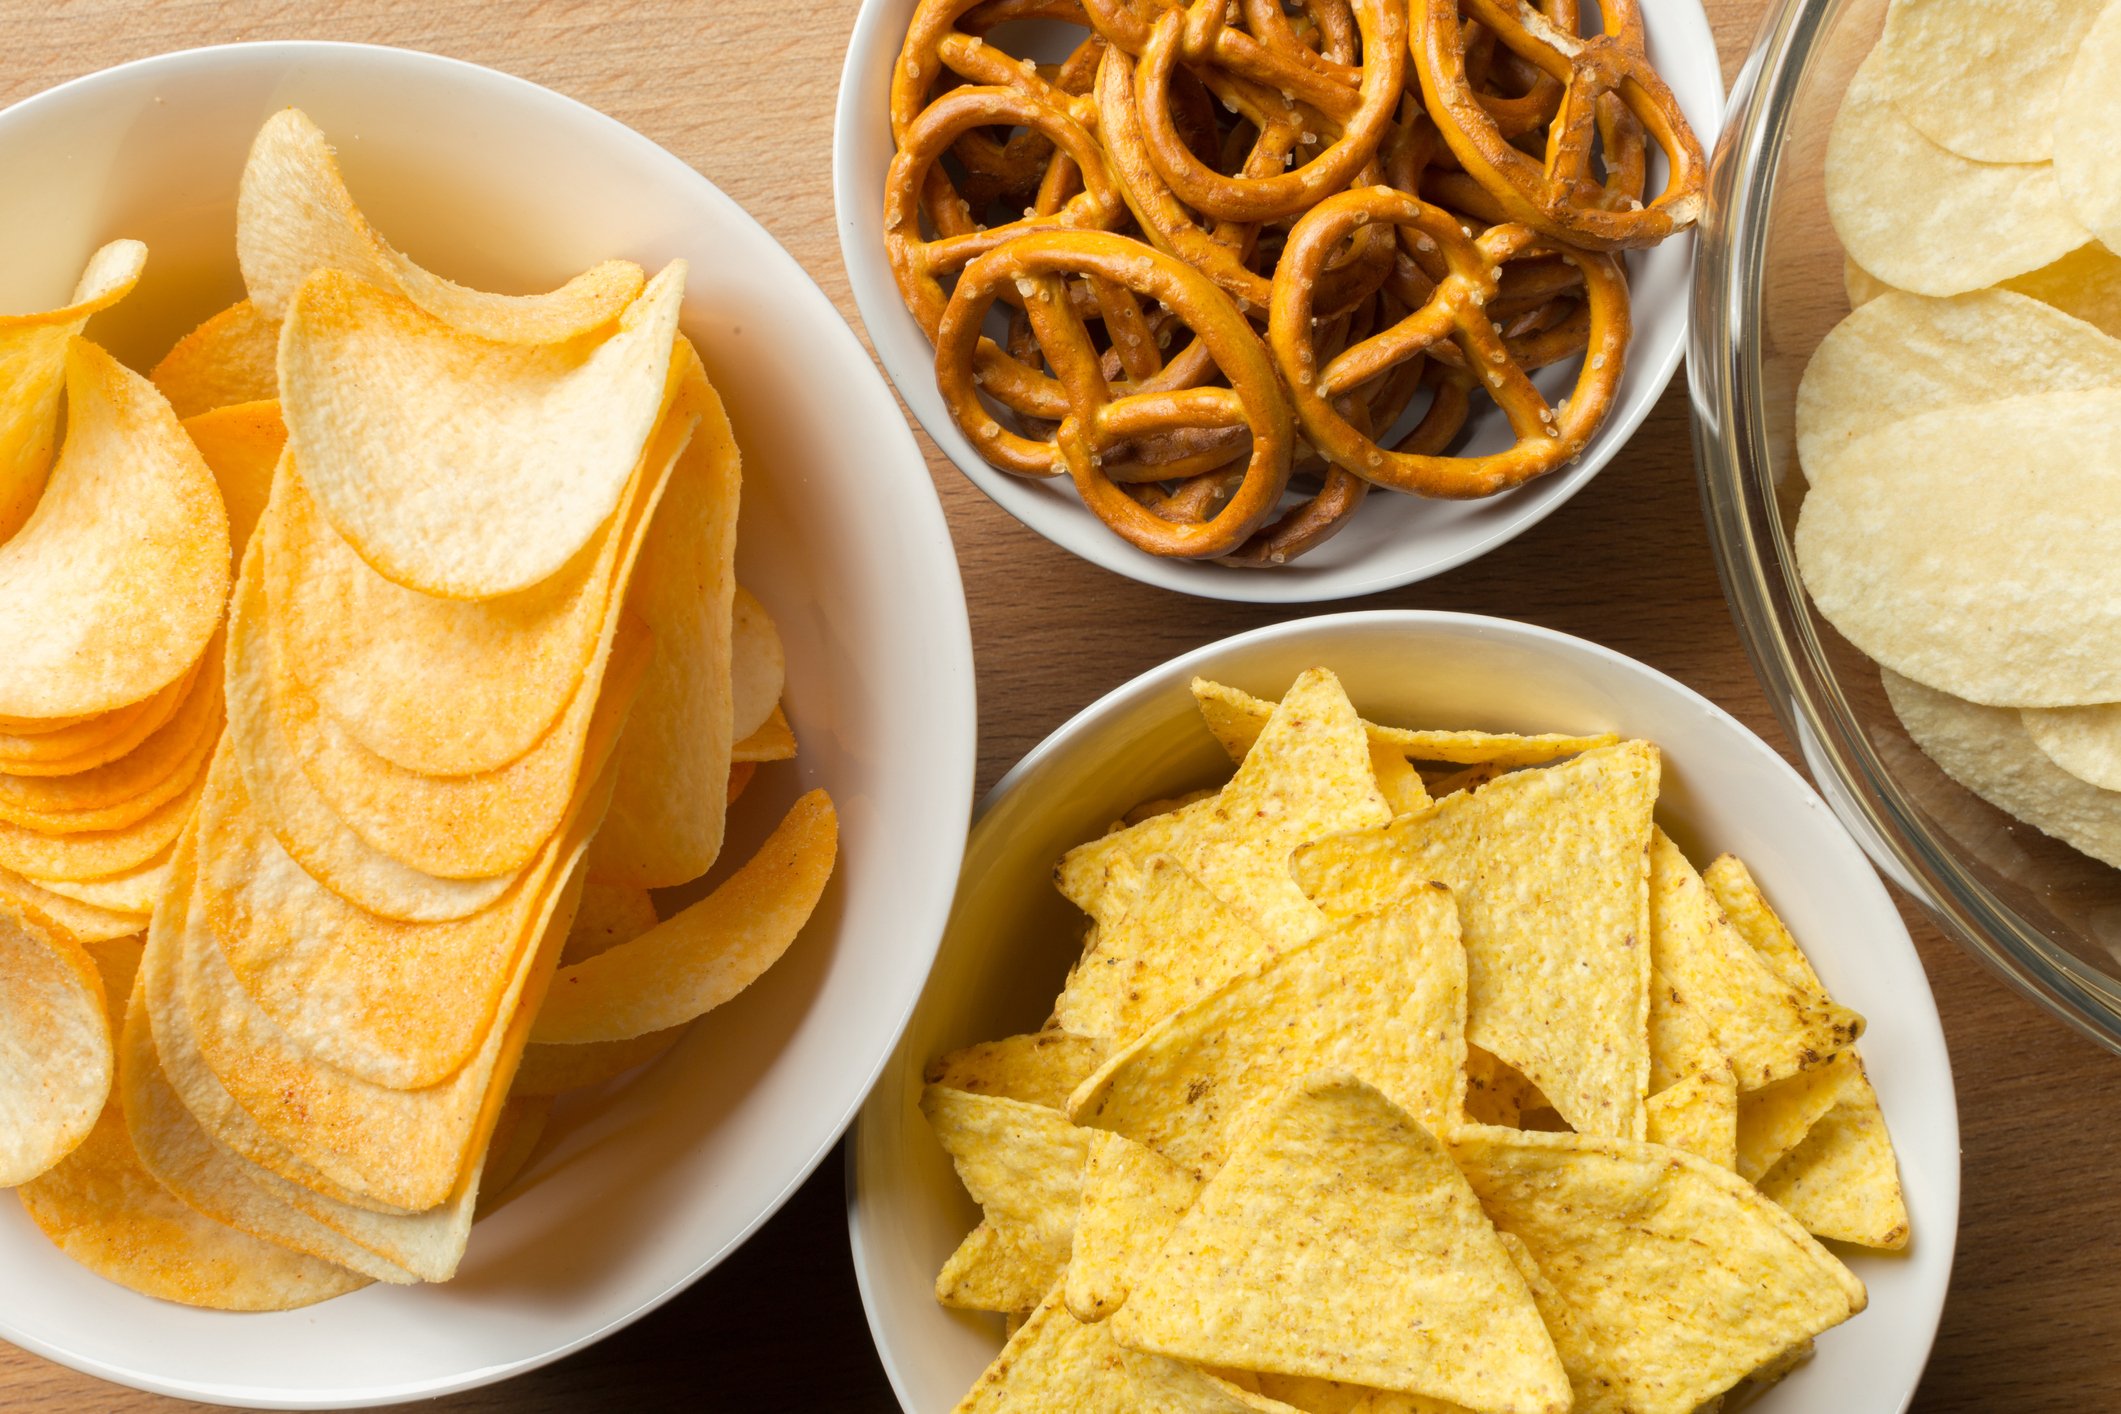
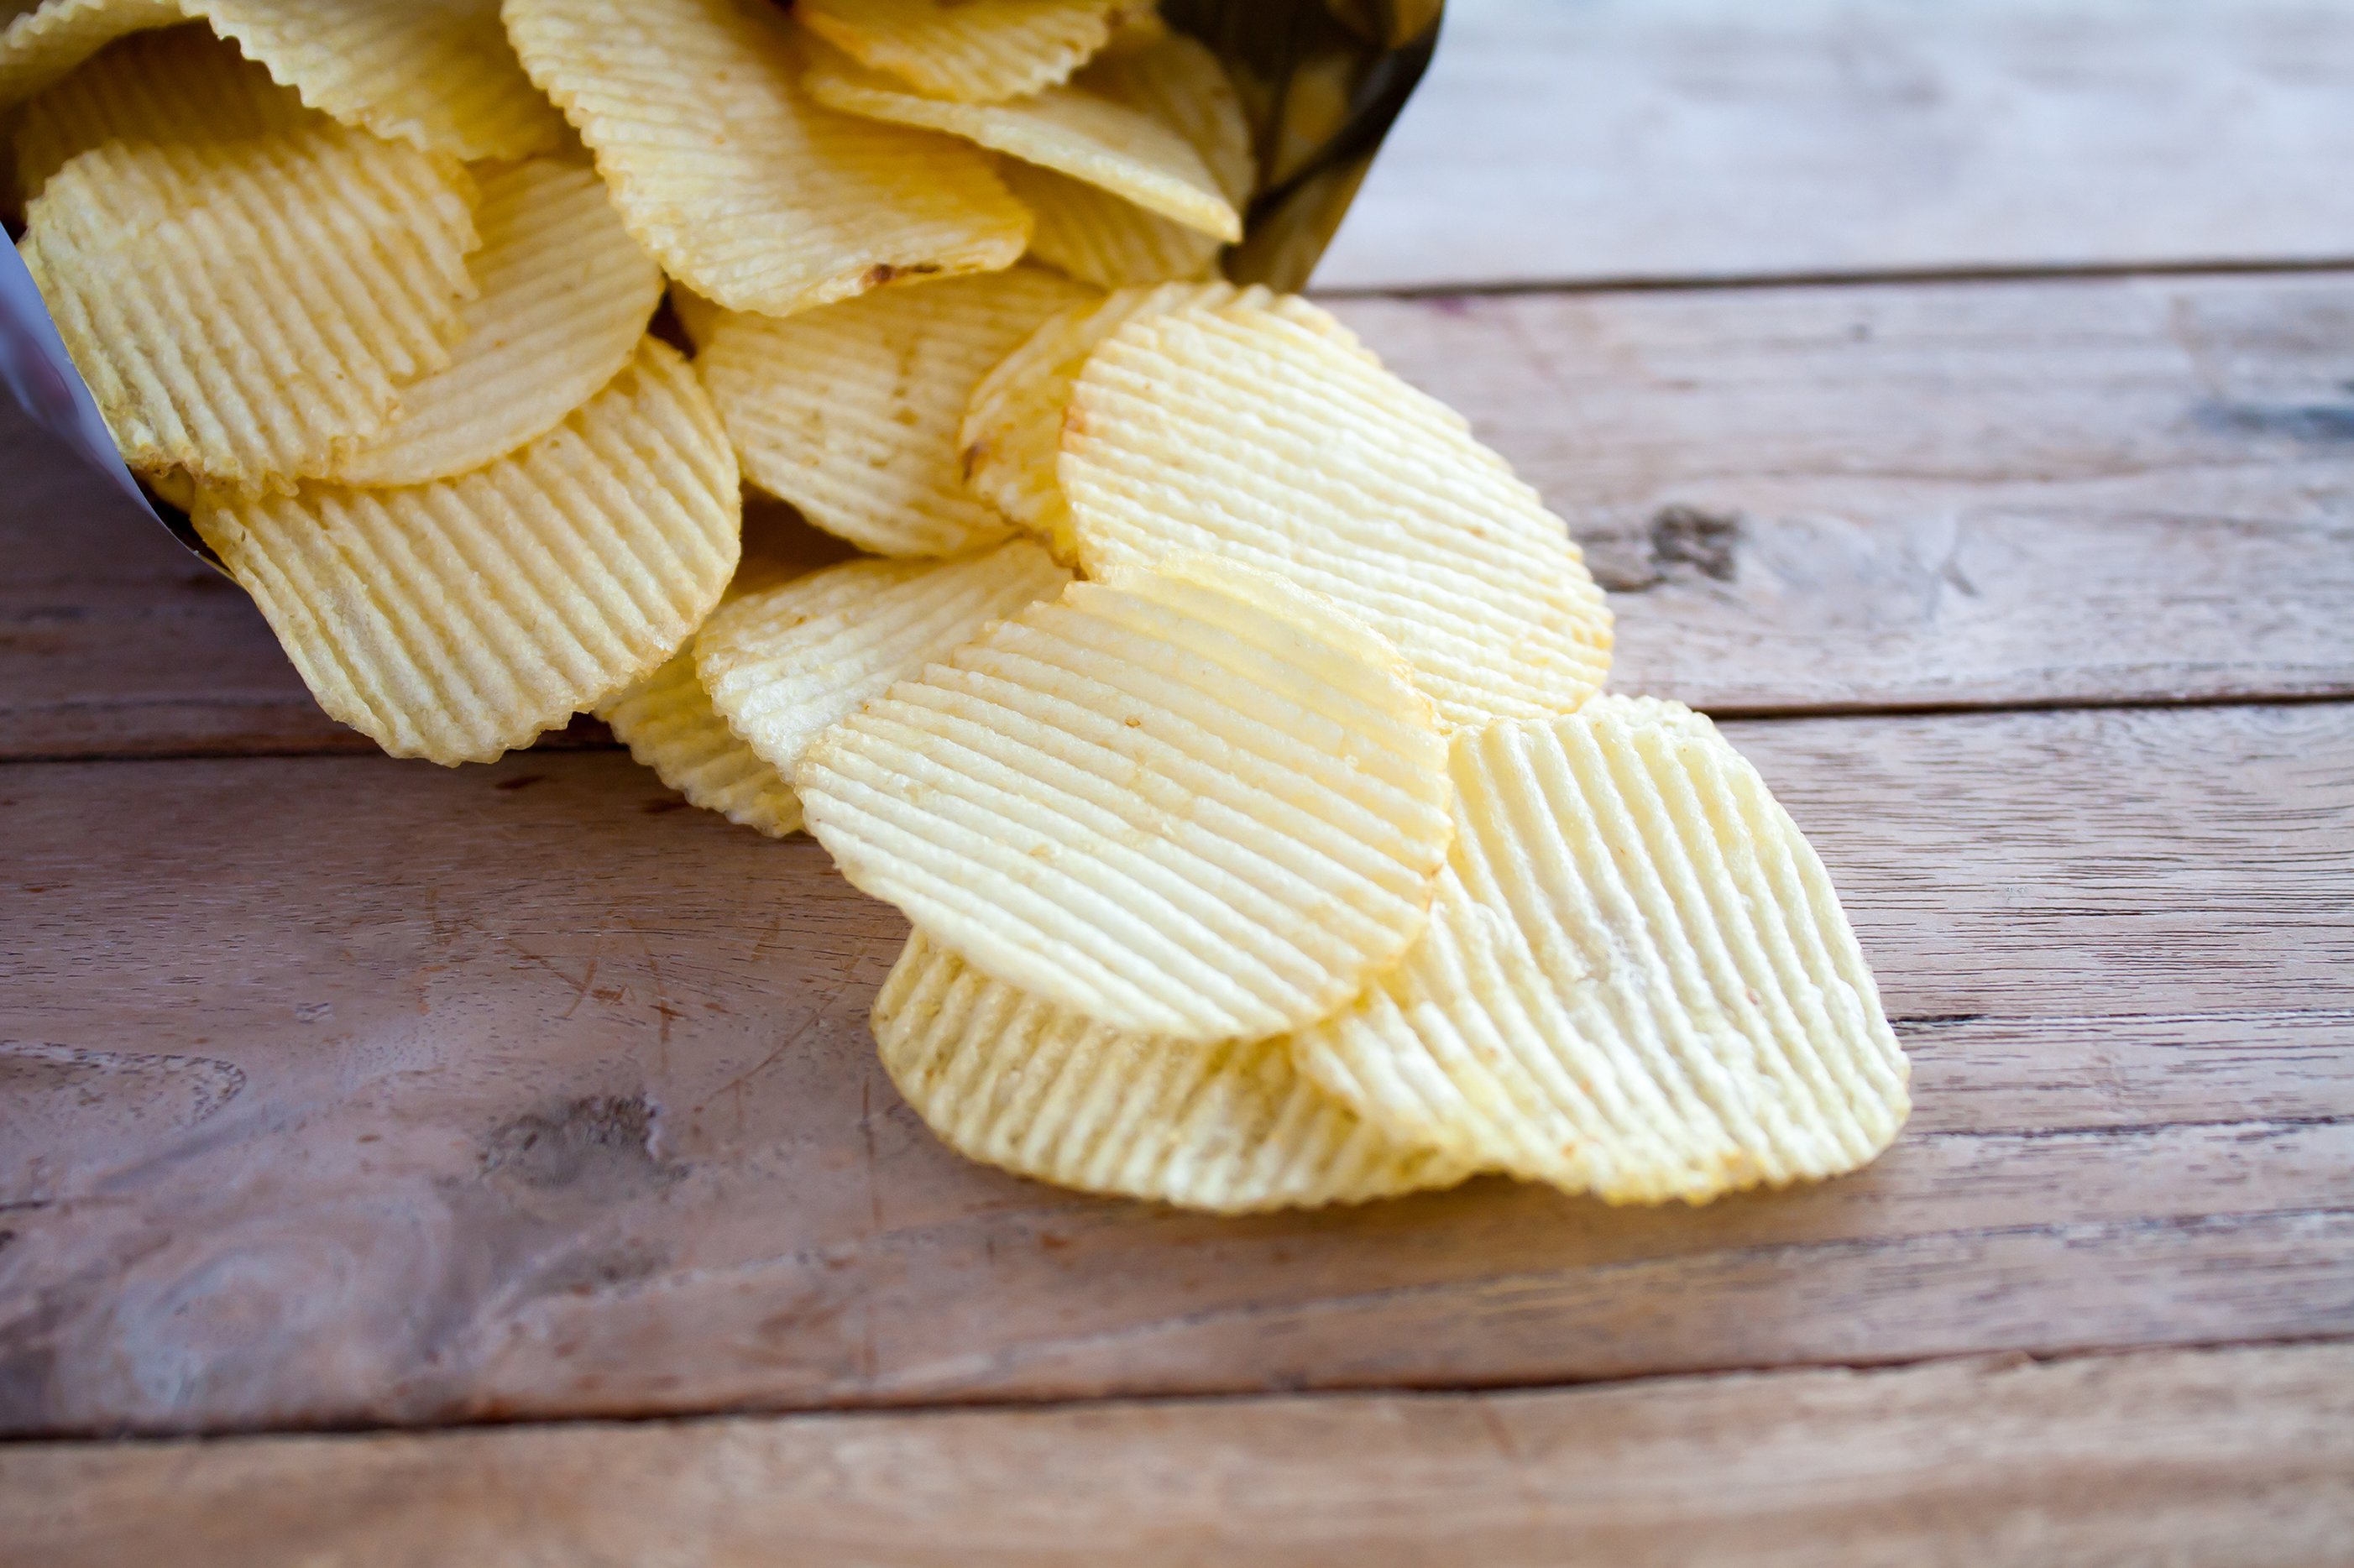
Utz makes potato chips and pretzels for people across America. They sell snacks to grocery stores and other retail shops. Their products help families find easy snacks for everyday life.

What’s in the Bag?

  • Utz Brand: Flagship line of potato chips and pretzels; generated more than $870 million in 2025 retail sales.
  • On The Border: National brand featuring tortilla chips, salsa, and queso; ranks as the second-largest unflavored tortilla chip brand in the U.S.
  • Boulder Canyon: Better-for-you snacks made with avocado and olive oils; grew 36.9% in the natural sales channel during 2025.
  • Zapp’s: Premium kettle-cooked potato chips; features flavors inspired by New Orleans like "Voodoo" and "Spicy Cajun Crawtators."
  • Regional Brands: Diverse snack labels like Golden Flake and Hawaiian; provides specialized local tastes such as Southern-style pork skins.

New Moves and Bigger Routes

  • Sold the Good Health and R.W. Garcia brands to Our Home in February 2024.
  • Sold manufacturing plants in Berlin, PA and Fitchburg, MA to Our Home in April 2024.
  • Closed the Grand Rapids, Michigan manufacturing facility in July 2025 to move production to larger plants.
  • Acquired distribution assets from Insignia International in October 2025 to expand sales in California.

How Utz Reaches Your Shelf

Utz uses a direct-store delivery system with about 2,500 routes to put fresh snacks directly onto more than 84,700 retail shelves. This system allows independent operators to manage their own territories while the company maintains eight main manufacturing plants across the United States.

The Financial Scorecard

  • Revenue reached $342.2 million in Q4 2025, up 0.3% from the previous year.
  • Free cash flow hit $51.3 million in Q4 2025, up 211.9% year-over-year.
  • Gross profit was negative $22.6 million in Q4 2025, worsened by 118.9% from $119.4 million in Q4 2024.
  • Net income reached negative $2.5 million in Q4 2025, improved from negative $27.7 million two years ago.

The Path Ahead

Utz has transformed from a regional snack maker into a national competitor by selling smaller brands and buying new distribution routes. This shift helps the company focus on its most popular snacks while making its delivery system more efficient.

AI Generated • May 4, 2026

Industry

Food Products

Employees

3,300

CEO

Howard A. Friedman, MBA

Headquarters

Hanover, PA 17331, US

UTZ Financials

Key Financial Metrics (TTM)

Gross Margin

22.31%

Operating Margin

-4.41%

Net Income Margin

-0.58%

Return on Equity

-1.17%

Return on Capital

5.24%

Return on Assets

-0.30%

Earnings Yield

-0.69%

Dividend Yield

1.78%

Payout Ratio

-2.75%

Stock Overview

Market Cap

$1.24BMarket cap calculated using publicly traded shares outstanding only. Does not include unlisted, private, or dual-class non-traded shares. Implied market cap may vary.

Shares Outstanding

88.54M

Volume

428.66K

Avg. Volume

3.22M

Financials (TTM)

Gross Profit

$323.00M

Operating Income

-$63.80M

EBITDA

$120.06M

Operating Cash Flow

$120.22M

Capital Expenditure

-$77.81M

Free Cash Flow

$42.41M

Cash & ST Invst.

$73.70M

Total Debt

$49.50M

Utz Brands Performance Analysis

Utz Brands annual revenue and year-over-year revenue growth by fiscal year
Fiscal yearPeriod endRevenueYoY growth
20222022-12-31USD 1,408,401,00019.3%
20232023-12-31USD 1,438,237,0002.1%
20242024-12-31USD 1,409,200,000-2.0%
20252025-12-31USD 1,438,800,0002.1%
Utz Brands sequential (quarter-over-quarter) revenue growth by fiscal quarter
Fiscal quarterPeriod endQoQ growth
Q22025-06-294.2%
Q32025-09-283.0%
Q42025-12-28-9.4%
Q12026-03-295.6%
Utz Brands annual diluted earnings per share and year-over-year EPS growth by fiscal year
Fiscal yearPeriod endDiluted EPSYoY growth
20222022-12-31USD -0.00N/A
20232023-12-31USD -0.316177.6%
20242024-12-31USD 0.19N/A
20252025-12-31USD 0.01-95.1%
Utz Brands sequential (quarter-over-quarter) diluted earnings per share growth by fiscal quarter
Fiscal quarterPeriod endQoQ growth
Q22025-06-2940.0%
Q32025-09-28-241.7%
Q42025-12-2883.2%
Q12026-03-2932.9%

Revenue Growth Rate

Annual and quarterly growth comparison

Earnings Per Share Growth Rate

Annual and quarterly EPS growth comparison

Quarterly Performance

Name
Q1 2026YOY CHG

Revenue

$361.30M

+2.6%

Gross Profit

$91.90M

-22.3%

Gross Margin

25.44%

N/A

Market Cap

$1.24BMarket cap calculated using publicly traded shares outstanding only. Does not include unlisted, private, or dual-class non-traded shares. Implied market cap may vary.

N/A

Market Cap/Employee

$377.22K

N/A

Employees

3,300

N/A

Net Income

-$1.70M

-122.7%

EBITDA

$31.10M

-10.9%

Quarterly Fundamentals

Name
Q1 2026YOY CHG

Total Cash

$73.70M

+17.5%

Total Debt

$49.50M

-95.2%

Accounts Receivable

$128.20M

-8.0%

Inventory

$122.50M

+13.9%

Long Term Debt

$13.10M

-98.7%

Short Term Debt

$36.40M

-14.3%

Return on Assets

-0.30%

N/A

Return on Invested Capital

-2.58%

N/A

Free Cash Flow

-$26.00M

+55.9%

Operating Cash Flow

-$12.20M

+39.7%

Other Investments to Explore

People Also Watch

Symbol / CompanyPricePrice Chg
THSTreeHouse Foods, Inc.
$24.43-0.08%
HLFHerbalife Nutrition Ltd.
$12.19+1.25%
EPCEdgewell Personal Care Company
$27.65-0.54%
SENEASeneca Foods Corporation
$165.00+1.01%

Trending Stocks

Symbol / CompanyPricePrice Chg
TAT&T
$23.04+0.04%
SMCISuper Micro Computer
$30.56+0.20%
AALAmerican Airlines Group
$14.79-0.03%
NUNu Holdings
$14.51+0.01%

Questions About UTZ

What is the current price of Utz Brands?

Utz Brands is trading at $14.07 per share.

What is the 52-week range for Utz Brands?

Over the past 52 weeks, Utz Brands has traded between $6.78 and $14.53.

How much debt does Utz Brands have?

As of the most recent reporting period, Utz Brands reported total debt of $1.04B.

How much cash does Utz Brands have on hand?

Utz Brands reported $73.70M in cash and cash equivalents in its most recent financial results.

What is Utz Brands’s dividend yield?

Utz Brands currently has a dividend yield of 1.78%.

Premium Investing Services

Invest better with The Motley Fool. Get stock recommendations, portfolio guidance, and more from The Motley Fool's premium services.