Accessibility Menu
AccessibilityHelp
The Motley Fool
  • All ServicesStock AdvisorEpicEpic PlusFool PortfoliosFool OnePodcasts HomeMotley Fool MoneyRule Breaker InvestingThe Motley Fool Foundation
  • Trending NewsStock Market NewsMarket MoversTech Stock NewsMarket TrendsConsumer Stock NewsCrypto NewsStock Market Indexes TodayMost Active Stocks TodayToday's Biggest Stock GainersToday's Biggest Stock LosersLargest Market Cap CompaniesMarket Research📨 Breakfast NewsTop Stocks to Buy NowBest ETFs to BuyBest AI StocksBest Growth StocksDividend KingsBest Index FundsNext Cryptos to ExplodeTechnologyEnergyReal EstateHealthcareConsumer GoodsMaterialsIndustrials
  • How to Invest MoneyWhat to Invest InHow to Invest in StocksHow to Invest in ETFsHow to Invest in Index FundsHow to Invest in BondsFinancial DictionaryStock Market 101Types of StocksStock Market SectorsStock Market IndexesWhat Are Stock Splits?What Is Compound Interest?After Hours TradingHow to Buy StockBest Brokers for BeginnersBest Brokerage AccountsGood Time to Buy StocksHow Many Shares to Buy?Portfolio DiversificationHow to Invest $100Magnificent Seven CompaniesWarren Buffett InvestmentsInvesting in ChatGPTInvesting in SpaceXInvesting in OpenAIInvesting in NvidiaInvesting in Databricks
  • Retirement 101Types of Retirement AccountsHow to Contribute to 401k/IRA?Strategies to Save for RetirementAsset Allocation for My AgeBest IRA Brokerage AccountsWithdrawal Rules for 401(k) PlansSocial Security 101How to Maximize Social Security?Full Retirement AgeCOLAsCalculate Your SS BenefitsCollecting Spousal BenefitsMaximize Social Security BenefitHow Much Do I Need to Retire?When To Retire401(k) Plans403(b) PlansRoth IRA PlansIRA PlansHSA PlansComplete Retirement GuideBest & Worst States to RetireAverage Retirement SavingsMoving for RetirementHealthcare in RetirementUnderstanding Taxes in Retirement401(k) Minimum Distributions
  • Best Credit CardsCompare Credit CardsCredit Card ReviewsCredit Card Guides and ToolsBest Savings AccountsBank ReviewsBest Personal LoansPersonal Loan ReviewsBest Mortgage LendersCurrent Mortgage RatesMortgage Lender ReviewsGuide to MortgagesAuto InsuranceHome InsuranceLife Insurance
  • About UsContact UsInvesting PhilosophyMotley Fool MoneyThe Motley Fool FoundationReviewsNewsroomFacebookTwitterYouTubeDiscussion BoardsCAPS - Stock Picking CommunityAdvertise With UsBecome an Affiliate PartnerPublishing StandardsAll ServicesStock AdvisorEpicEpic PlusFool PortfoliosFool One
  • 67% off* Labor Day Sale! ›
67% off* Labor Day Sale! ›
Arrow-Thin-Down
S&P 500
6,501.86
+0.3%
+20.46
Arrow-Thin-Down
DJI
45,636.90
+0.2%
+71.67
Arrow-Thin-Down
NASDAQ
21,705.16
+0.5%
+115.02
Arrow-Thin-Down
Bitcoin
$111,375
-1.4%
-$1,561.79
Arrow-Thin-Down
AAPL
$232.56
+0.9%
+$2.07
Arrow-Thin-Down
AMZN
$231.6
+1.1%
+$2.48
Arrow-Thin-Down
GOOG
$212.37
+2.0%
+$4.16
Arrow-Thin-Down
META
$751.11
+0.5%
+$3.73
Arrow-Thin-Down
MSFT
$509.64
+0.6%
+$2.9
Arrow-Thin-Down
NVDA
$180.17
-0.8%
-$1.43
Arrow-Thin-Down
TSLA
$346.03
-1.0%
-$3.57
Daily Stock GainersDaily Stock LosersMost Active Stocks

Premium Investing Services

Invest better with The Motley Fool. Get stock recommendations, portfolio guidance, and more from The Motley Fool's premium services.

View Premium Services
The Motley Fool

Making the world smarter, happier, and richer.

  • Facebook
  • Twitter
  • LinkedIn
  • Pinterest
  • YouTube
  • Instagram
  • TikTok

© 1995 - 2025 The Motley Fool. All rights reserved.

Market data powered by Xignite and Polygon.io.

About The Motley Fool

  • About Us
  • Careers
  • Research
  • Newsroom
  • Contact
  • Advertise

Our Services

  • All Services
  • Stock Advisor
  • Epic
  • Epic Plus
  • Fool Portfolios
  • Fool One
  • Motley Fool Money

Around the Globe

  • Fool UK
  • Fool Australia
  • Fool Canada

Free Tools

  • CAPS Stock Ratings
  • Discussion Boards
  • Calculators
  • Financial Dictionary

Affiliates & Friends

  • Motley Fool Asset Management
  • Motley Fool Wealth Management
  • Motley Fool Ventures
  • Fool Community Foundation
  • Become an Affiliate Partner
  • Terms of Use
  • Privacy Policy
  • Disclosure Policy
  • Accessibility Policy
  • Copyright, Trademark and Patent Information
  • Terms and Conditions
  • Do Not Sell My Personal Information
How to Calculate Amortization and Depreciation on an Income Statement
  1. >
  2. >
  3. >

How to Calculate Amortization and Depreciation on an Income Statement

By Motley Fool Staff – Updated April 30, 2025
  • The process
  • Financials
  • Final thought
Home
Investing
Essential Financial Formulas You Should Know
Amortization And Depreciation On An Income Statement

Related Articles

Person Concerned 2
Social Security's 2026 Cost-of-Living Adjustment (COLA) Predictions Are Ticking Upward. Here's Why That's Not a Good Thing.
Social Security cards 6_GettyImages-184127461
3 Social Security Changes That Could Have a Huge Impact on Your Retirement
Retiring Early
This Appears to Be the Reason So Many Americans Are Claiming Social Security Early
AI
Here's What Retirees Must Know About AI Scams
Couple looking at computer together
Your 2026 COLA Is On Track to Break a 30-Year Streak
Bonds
Saving for Retirement? How to Know When It's Time to Move Into Bonds
senior man document laptop calculator GettyImages-1400536618
3 Medicare Moves That Could Save Retirees Big Money
Loading paragraph...
Definition Icon

Asset

An asset is a resource used to hold or create economic value.
Loading paragraph...
Loading image...
Loading paragraph...
Loading table...
Loading paragraph...
Loading hub_pages...
Loading paragraph...
Key findings are powered by ChatGPT and based solely off the content from this article. Findings are reviewed by our editorial team. The author and editors take ultimate responsibility for the content.
The Motley Fool has a disclosure policy.

A businessperson reviewing an income statement.
Image source: Getty Images.

Amortization and depreciation are non-cash expenses on a company's income statement. Depreciation represents the cost of using capital assets on the balance sheet over time, and amortization is the similar cost of using intangible assets, like goodwill, over time.

Calculating the proper expense amount for amortization and depreciation on an income statement varies from one specific situation to another. However, we can use a simple example to understand the basics.

The process starts on the balance sheet and ends on the income statement

The accounting of amortization and depreciation is essentially the same. So, for our example, we can simplify the process and just consider a simple equipment purchase. Remember that an intangible asset would amortize in a very similar way over time, whether it's intellectual property, goodwill, or another account.

When a company buys a capital asset, such as equipment, it reports that asset on its balance sheet at its purchase price. Let's say our company buys a piece of equipment for $15,000. That means our equipment asset account increases by $15,000 on the balance sheet. Nothing has been reported on the income statement yet.

Over the next year, though, the company will begin to recognize a depreciation expense for the equipment, representing its gradual obsolescence, loss of value from use, and increased age. That expense, which appears on the income statement, is not for the full purchase price of the equipment but rather an incremental amount calculated from accounting formulas.

The first step in this calculation is determining which depreciation method to use to determine the proper expense amount. The simplest method is the straight-line method, where depreciation expense is constant over time as the equipment is used.

Other methods allow the company to recognize more depreciation expense earlier in the life of the asset. The key is for the company to have a consistent policy and well-defined procedures justifying the method. For simplicity, we'll use the straight-line method in this example.

First, the company must determine the asset's value at the end of its useful life. This salvage value, or residual value, is subtracted from the purchase price and then divided by the number of years in the asset's useful life. In the case of our equipment, the company expects a seven-year useful life, at which time the equipment will be worth $4,500, its residual value.

Completing the calculation, the purchase price ($15,000) minus the residual value ($4,500) is $10,500. Divided by seven years of useful life, this gives us an annual depreciation expense of $1,500. This will be the depreciation expense the company recognizes for the equipment every year for the next seven years.

How this calculation appears on the financial statements over time

For the next seven years, the company will recognize an annual depreciation expense of $1,500 on the income statement. At the same time, the book value of the equipment will reduce on the balance sheet by that same $1,500 per year. The reduction in book value is recorded via an account called accumulated depreciation. The chart below summarizes the seven-year accounting life of this equipment.

Year
Depreciation Expense
Original Book Value
Accumulated Depreciation
NET Book Value
Year 0: Purchase
$1,500
$15,000
$0
$15,000
Year 1
$1,500
$15,000
$1,500
$13,500
Year 2
$1,500
$15,000
$3,000
$12,000
Year 3
$1,500
$15,000
$4,500
$10,500
Year 4
$1,500
$15,000
$6,000
$9,000
Year 5
$1,500
$15,000
$7,500
$7,500
Year 6
$1,500
$15,000
$9,000
$6,000
Year 7
$1,500
$15,000
$10,500
$4,500

The income statement is hit with a $1,500 depreciation expense each year. That expense is offset on the balance sheet by the increase in accumulated depreciation, which reduces the equipment's net book value. As implied in the name of the straight-line method, this process is repeated in the same amounts every year.

One final consideration on depreciation and amortization expenses

In strict terms, amortization and depreciation are non-cash expenses. In the example above, the company does not write a check each year for $1,500. Instead, amortization and depreciation are used to represent the economic cost of obsolescence, wear and tear, and the natural decline in an asset's value over time.

Related investing topics

How to Calculate a Monthly Return on Investment
Monitor short-term returns for portfolio insight. Calculate monthly returns accurately. Emphasize long-term success in investing.
How to Calculate the Historical Variance of Stock Returns
The following article will show you how to calculate the historical variance of stock returns with a detailed example.
How to Calculate the Weights of Stocks
The weights of your stocks can play a big role in your investment strategy. Here's how to calculate them.
How to Calculate Foreign Exchange Gains or Losses
Learn how to interpret a foreign exchange quote and how to think about gains and losses -- with examples.

However, while there may not be real cash expenses for amortization and depreciation each year, these are real expenses an analyst should pay attention to. For example, if the equipment purchased above is critical to the business, it will have to be replaced eventually for the company to operate. That purchase is a real cash event, even if it only comes once every seven or 10 years.

In many cases, treating amortization or depreciation as a non-cash event can be appropriate. However, the best analysts will first understand what is being amortized or depreciated, understand how those assets fit into the company's operations, and then make a conscious decision that makes the most sense for that specific situation in regard to the treatment of these expenses.

Need help navigating your way around an income statement? We have the tools to help you get started investing. Just head on over to our Broker Center.

This article is part of The Motley Fool's Knowledge Center, which was created based on the collected wisdom of a fantastic community of investors. We'd love to hear your questions, thoughts, and opinions on the Knowledge Center in general or this page in particular. Your input will help us help the world invest better! Email us at [email protected]. Thanks -- and Fool on!

Our Guides

Documents and a calculator
How to Calculate Net Change in Cash From a Cash Flow Statement
How to Calculate Accrued Interest
Two people sit at table with calculator and paperwork.
How to Calculate Semi-Annual Bond Yield
Man in front of blackboard with investing-related pictures and words drawn on it
How to Calculate a Monthly Return on Investment
stock certificates
How to Calculate the Number of Shares a Company Has
how-to-calculate-the-price-of-a-treasury-bill-infographic
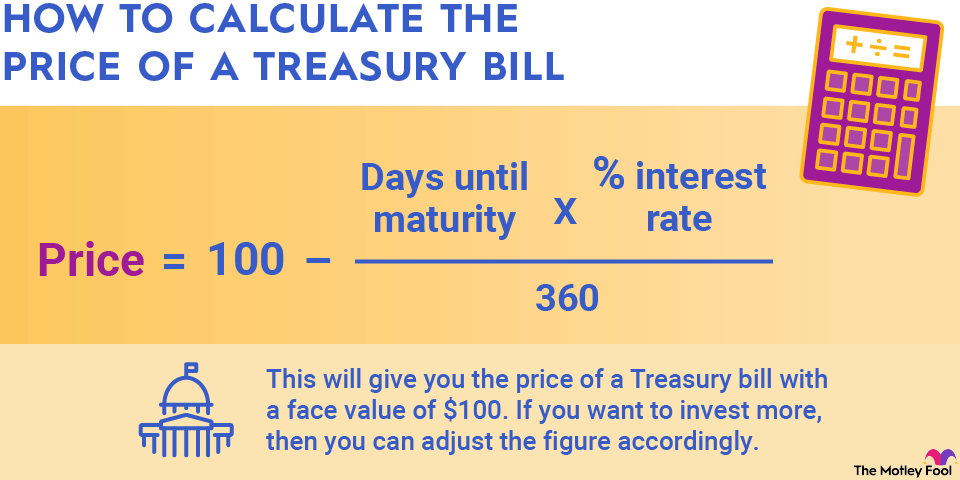
How to Calculate the Price of a Treasury Bill
GettyImages-1309118129.jpg
Calculating the Percentage of an Over-Budgeted Amount
Yellow road sign warning Volatility Ahead against backdrop of beautiful blue sky
How to Calculate Annualized Volatility
Calculator and paperwork on desk
How to Calculate Tax on W-9 Income
how-to-calculate-taxable-amount-of-ira-withdrawal-infographic
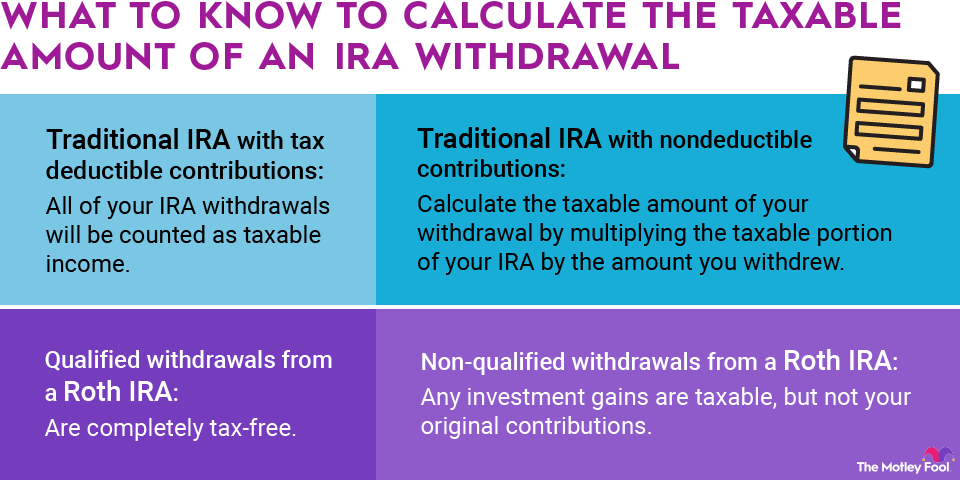
How to Calculate the Taxable Amount of an IRA Withdrawal
A business person calculating profit from revenue.
How to Calculate Revenue Growth for 3 Years
red decline stocks down bear
How to Calculate the Percentage of Annual Decline
A small child hitting a baseball off of a tee
How to Calculate the Present Value of Free Cash Flow
A person making a financial calculation.
How to Calculate Average Shareholder Equity
Someone writing a complex mathematical equation on a chalk board.
How to Calculate Interest Rate Using Present and Future Value
Businessperson reviewing income statement
How to Calculate the Net Worth on Financial Statements
Hands pulling a paycheck out of an envelope
How to Calculate Take-Home Pay as a Percentage of Gross Pay
how-to-calculate-interest-rates-and-penalties-on-late-taxes-infographic
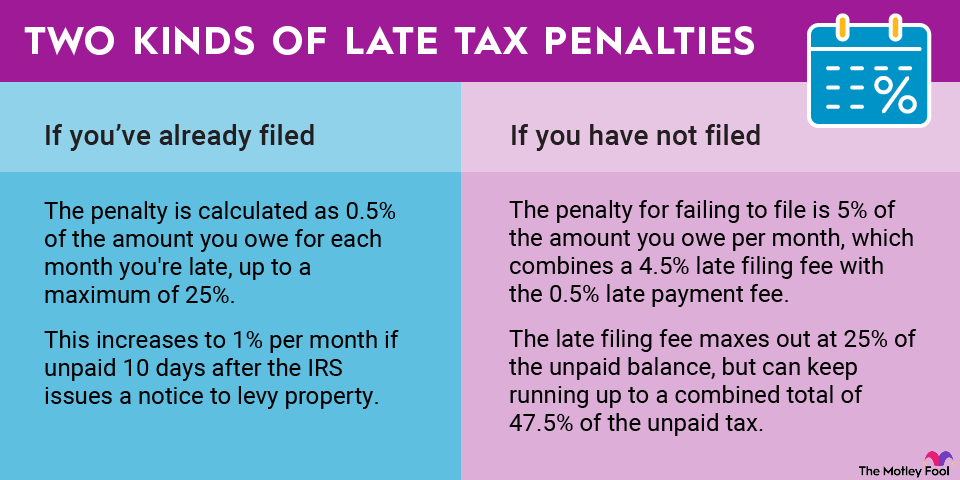
How to Calculate Interest Rate and Penalties on Late Taxes
Person sitting in front of blocks spelling GDP.
How to Calculate the Annual Growth Rate for Real GDP
Hands pulling a paycheck out of an envelope
How to Calculate Taxes Using a Paycheck Stub
Ad

Alert: Top Cash Back Card Now Offers 0% Intro APR Until Nearly 2027

Enjoy 0% intro APR on purchases and balance transfers for 15 months—plus up to 5% cash back in popular categories.

Click Here to Start Earning More ›

Motley Fool Returns

Motley Fool Stock Advisor

Market-beating stocks from our flagship service.

Stock Advisor Returns
1068%
S&P 500 Returns
186%

Calculated by average return of all stock recommendations since inception of the Stock Advisor service in February of 2002. Returns as of 2025-08-29 05:21:11.823267.

Discounted offers are only available to new members. Stock Advisor list price is $199 per year.

Join Stock Advisor
Cumulative Growth of a $10,000 Investment in Stock Advisor

Calculated by Time-Weighted Return since 2002. Volatility profiles based on trailing-three-year calculations of the standard deviation of service investment returns.

Chart Showing the Cumulative Growth of a $10,000 Investment in Stock Advisor