Accessibility Menu
DigitalOcean logo

DigitalOcean(NYSE) DOCN

Market Cap$13.45BMarket cap calculated using publicly traded shares outstanding only. Does not include unlisted, private, or dual-class non-traded shares. Implied market cap may vary.
Since IPO (2021)+169%
5 Year+115%
1 Year+279%
1 Month-16%
Premium Feature
Moneyball Superscore
86/100
$115.02
+0.59%
+0.67Today
DigitalOcean last closing stock price
MetricPriceDate
Last closeUSD 114.352026-08-20
DigitalOcean stock price return by period
PeriodPrice returnPrice at period startPeriod start date
1 week-13.56%USD 132.292026-08-13
1 month-16.2%USD 136.452026-07-21
3 month-27.84%USD 158.462026-05-22
Year to date+137.64%USD 48.122025-12-31
1 year+278.52%USD 30.212025-08-20
3 year+252.93%USD 32.402023-08-21
5 year+115.06%USD 53.172021-08-20
Since inception+169.06%USD 42.502021-03-24

DigitalOcean Financials at a Glance

Market Cap

$13.45BMarket cap calculated using publicly traded shares outstanding only. Does not include unlisted, private, or dual-class non-traded shares. Implied market cap may vary.

Revenue (TTM)

$1.01B

Net Income (TTM)

$235.24M

EPS (TTM)

$2.19

P/E Ratio

52.13

Dividend

$0.00

Beta (Volatility)

2.26 (High)

Price

$115.02

Volume

1,650,404.43

Open

$115.78

Previous Close

$114.35

Daily Range

$111.62 - $116.74

52-Week Range

$30.05 - $187.50

Estimated Earnings Date

Nov 4, 2026

About DigitalOcean

DigitalOcean Holdings, Inc. helps small businesses build apps in the cloud. It provides digital tools to run software without owning physical servers. This helps manage technical complexity and software costs.

What Is in the Stack?

  • Infrastructure-as-a-Service: Virtual machines, storage, and networking tools for basic computing; serves users across approximately 190 countries.
  • Platform-as-a-Service: Managed database and Kubernetes tools that handle technical setup for software developers.
  • AI-Native Cloud: GPU infrastructure and specialized platforms for building and running artificial intelligence applications.
  • Digital Native Enterprise Focus: Targeted services for customers spending over $500 monthly; accounted for 67% of revenue in the three-month period ended June 30, 2026.

Strategic Moves and New Tech

  • Acquired Paperspace to launch artificial intelligence and machine learning infrastructure and software tools.
  • Purchased Cloudways to provide simplified managed hosting for businesses running online platforms.
  • Completed a public equity offering in March 2026 that raised $887.9 million in net proceeds.
  • Repurchased $471.8 million of convertible debt in July 2026 to manage its long-term liabilities.
  • Acquired an AI-related business during the six-month period ended June 30, 2026.

Global Reach and Simple Selling

DigitalOcean operates a highly efficient self-service model where thousands of new users join every month without direct sales contact. Its global infrastructure serves customers across 190 countries, with 47% of revenue coming from North America.

Key Performance Metrics

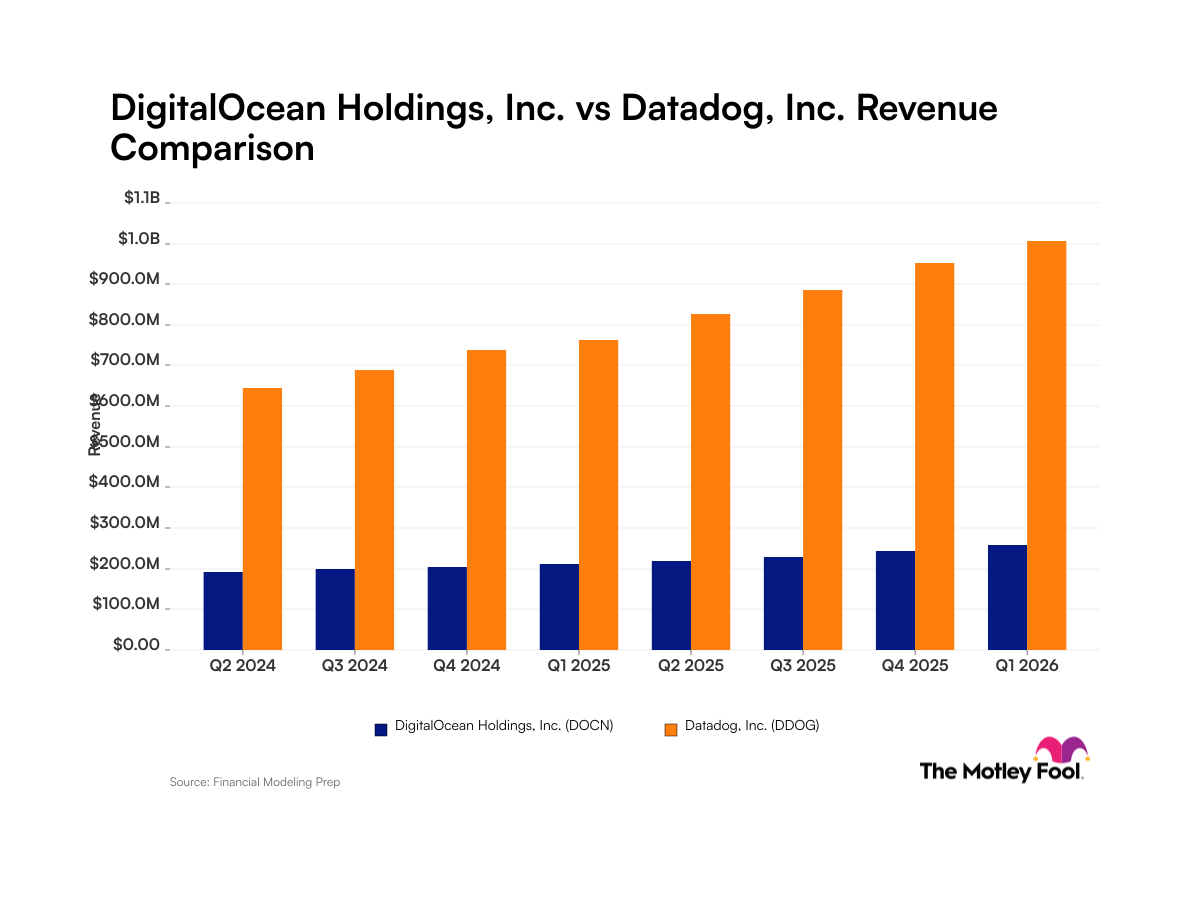
  • Revenue was $281.2 million in the three-month period ended June 30, 2026, up 29% year over year.
  • Annual run-rate revenue reached $1.1 billion as of June 30, 2026, up from $875 million on June 30, 2025.
  • AI Customer ARR grew to $234 million as of June 30, 2026, up from $75 million one year earlier.
  • Net income was $35.4 million in the three-month period ended June 30, 2026, compared to $37.0 million in the same period in 2025.
  • Digital Native Enterprise customers grew to 22,000 as of June 30, 2026, from 20,000 as of June 30, 2025.

Evolution of a Cloud Platform

DigitalOcean has transitioned from a basic cloud provider for developers into an integrated AI and cloud platform for growing businesses. By combining simple infrastructure with advanced machine learning tools, it maintains a distinct niche against larger cloud competitors.

AI Generated • Aug 5, 2026

Industry

IT Services

Employees

1,462

CEO

Padmanabhan T. Srinivasan, MBA

Headquarters

Broomfield, CO 80021, US

DOCN Financials

Key Financial Metrics (TTM)

Gross Margin

57.22%

Operating Margin

14.80%

Net Income Margin

23.27%

Return on Equity

54.71%

Return on Capital

22.37%

Return on Assets

7.53%

Earnings Yield

1.92%

Dividend Yield

0.00%

Payout Ratio

0.00%

Stock Overview

Market Cap

$13.45BMarket cap calculated using publicly traded shares outstanding only. Does not include unlisted, private, or dual-class non-traded shares. Implied market cap may vary.

Shares Outstanding

117.58M

Volume

1.65M

Avg. Volume

3.36M

Financials (TTM)

Gross Profit

$578.58M

Operating Income

$149.67M

EBITDA

$374.11M

Operating Cash Flow

$356.88M

Capital Expenditure

-$342.00M

Free Cash Flow

$14.88M

Cash & ST Invst.

$767.03M

Total Debt

$1.50B

DigitalOcean Performance Analysis

DigitalOcean annual revenue and year-over-year revenue growth by fiscal year
Fiscal yearPeriod endRevenueYoY growth
20222022-12-31USD 576,322,00034.5%
20232023-12-31USD 692,884,00020.2%
20242024-12-31USD 780,615,00012.7%
20252025-12-31USD 901,427,00015.5%
DigitalOcean sequential (quarter-over-quarter) revenue growth by fiscal quarter
Fiscal quarterPeriod endQoQ growth
Q32025-09-305.0%
Q42025-12-315.6%
Q12026-03-316.4%
Q22026-06-309.0%
DigitalOcean annual diluted earnings per share and year-over-year EPS growth by fiscal year
Fiscal yearPeriod endDiluted EPSYoY growth
20222022-12-31USD -0.2851.6%
20232023-12-31USD 0.22N/A
20242024-12-31USD 0.92328.3%
20252025-12-31USD 2.52172.8%
DigitalOcean sequential (quarter-over-quarter) diluted earnings per share growth by fiscal quarter
Fiscal quarterPeriod endQoQ growth
Q32025-09-30287.2%
Q42025-12-31-83.4%
Q12026-03-31-40.0%
Q22026-06-3093.3%

Revenue Growth Rate

Annual and quarterly growth comparison

Earnings Per Share Growth Rate

Annual and quarterly EPS growth comparison

Quarterly Performance

Name
Q2 2026YOY CHG

Revenue

$281.18M

+28.6%

Gross Profit

$154.66M

+18.1%

Gross Margin

55.00%

N/A

Market Cap

$13.45BMarket cap calculated using publicly traded shares outstanding only. Does not include unlisted, private, or dual-class non-traded shares. Implied market cap may vary.

N/A

Market Cap/Employee

$9.20M

N/A

Employees

1,462

N/A

Net Income

$35.44M

-4.3%

EBITDA

$34.61M

-55.3%

Quarterly Fundamentals

Name
Q2 2026YOY CHG

Total Cash

$767.03M

+97.8%

Total Debt

$1.50B

-15.0%

Accounts Receivable

$115.00M

+41.5%

Inventory

$0.00

N/A

Long Term Debt

$1.06B

-36.5%

Short Term Debt

$441.43M

+349.4%

Return on Assets

7.53%

N/A

Return on Invested Capital

6.38%

N/A

Free Cash Flow

$63.53M

+7.2%

Operating Cash Flow

$156.89M

+69.7%

Other Investments to Explore

People Also Watch

Symbol / CompanyPricePrice Chg
PLXSPlexus Corp.
$240.30-0.67%
QLYSQualys, Inc.
$181.03-0.64%
VRNSVaronis Systems, Inc.
$41.09+0.58%
BOXBox, Inc.
$32.73-0.52%

Trending Stocks

Symbol / CompanyPricePrice Chg
TSLLDirexion Shares ETF Trust - Direxion Daily Tsla Bull 2x ETF
$9.89+0.11%
BITOProShares Trust - ProShares Bitcoin ETF
$10.37+0.06%
IBITiShares Bitcoin Trust
$43.45+0.05%
MARAMara Holdings
$11.22+0.01%

Questions About DOCN

What is the current price of DigitalOcean?

DigitalOcean is trading at $115.04 per share.

What is the 52-week range for DigitalOcean?

Over the past 52 weeks, DigitalOcean has traded between $30.05 and $187.50.

How much debt does DigitalOcean have?

As of the most recent reporting period, DigitalOcean reported total debt of $1.98B.

How much cash does DigitalOcean have on hand?

DigitalOcean reported $767.03M in cash and cash equivalents in its most recent financial results.

What is DigitalOcean’s dividend yield?

DigitalOcean does not currently have a dividend yield.

Premium Investing Services

Invest better with The Motley Fool. Get stock recommendations, portfolio guidance, and more from The Motley Fool's premium services.