Accessibility Menu
Flowserve logo

Flowserve(NYSE) FLS

Current Price$68.61
Market Cap$8.63BMarket cap calculated using publicly traded shares outstanding only. Does not include unlisted, private, or dual-class non-traded shares. Implied market cap may vary.
Since IPO (1983)+7,801%
5 Year+82%
1 Year+29%
1 Month-16%
Flowserve last closing stock price
MetricPriceDate
Last closeUSD 68.592026-07-22
Flowserve stock price return by period
PeriodPrice returnPrice at period startPeriod start date
1 week-0.44%USD 68.892026-07-15
1 month-15.68%USD 81.342026-06-22
3 month-16.02%USD 81.672026-04-23
Year to date-0.55%USD 68.972025-12-31
1 year+28.97%USD 53.182025-07-22
3 year+92.09%USD 35.712023-07-21
5 year+81.67%USD 37.752021-07-23
Since inception+7,801.04%USD 0.851983-08-23

Flowserve Financials at a Glance

Market Cap

$8.63BMarket cap calculated using publicly traded shares outstanding only. Does not include unlisted, private, or dual-class non-traded shares. Implied market cap may vary.

Revenue (TTM)

$4.65B

Net Income (TTM)

$354.02M

EPS (TTM)

$2.70

P/E Ratio

24.99

Dividend

$0.86

Beta (Volatility)

1.21 (Average)

Price

$68.61

Volume

85,634

Open

$67.21

Previous Close

$68.61

Daily Range

$67.12 - $69.22

52-Week Range

$48.71 - $92.41

Estimated Earnings Date

Jul 29, 2026

FLS: Motley Fool Moneyball Superscore

76

Our CEO Is Handing Members His Secret Weapon

It's called Motley Fool Moneyball, our new proprietary AI tool

We spent over half a million dollars in R&D to build a tool that makes stock research faster, sharper, and smarter. Our analysts use it every day, and now, you can too.

Get Access Now

About Flowserve

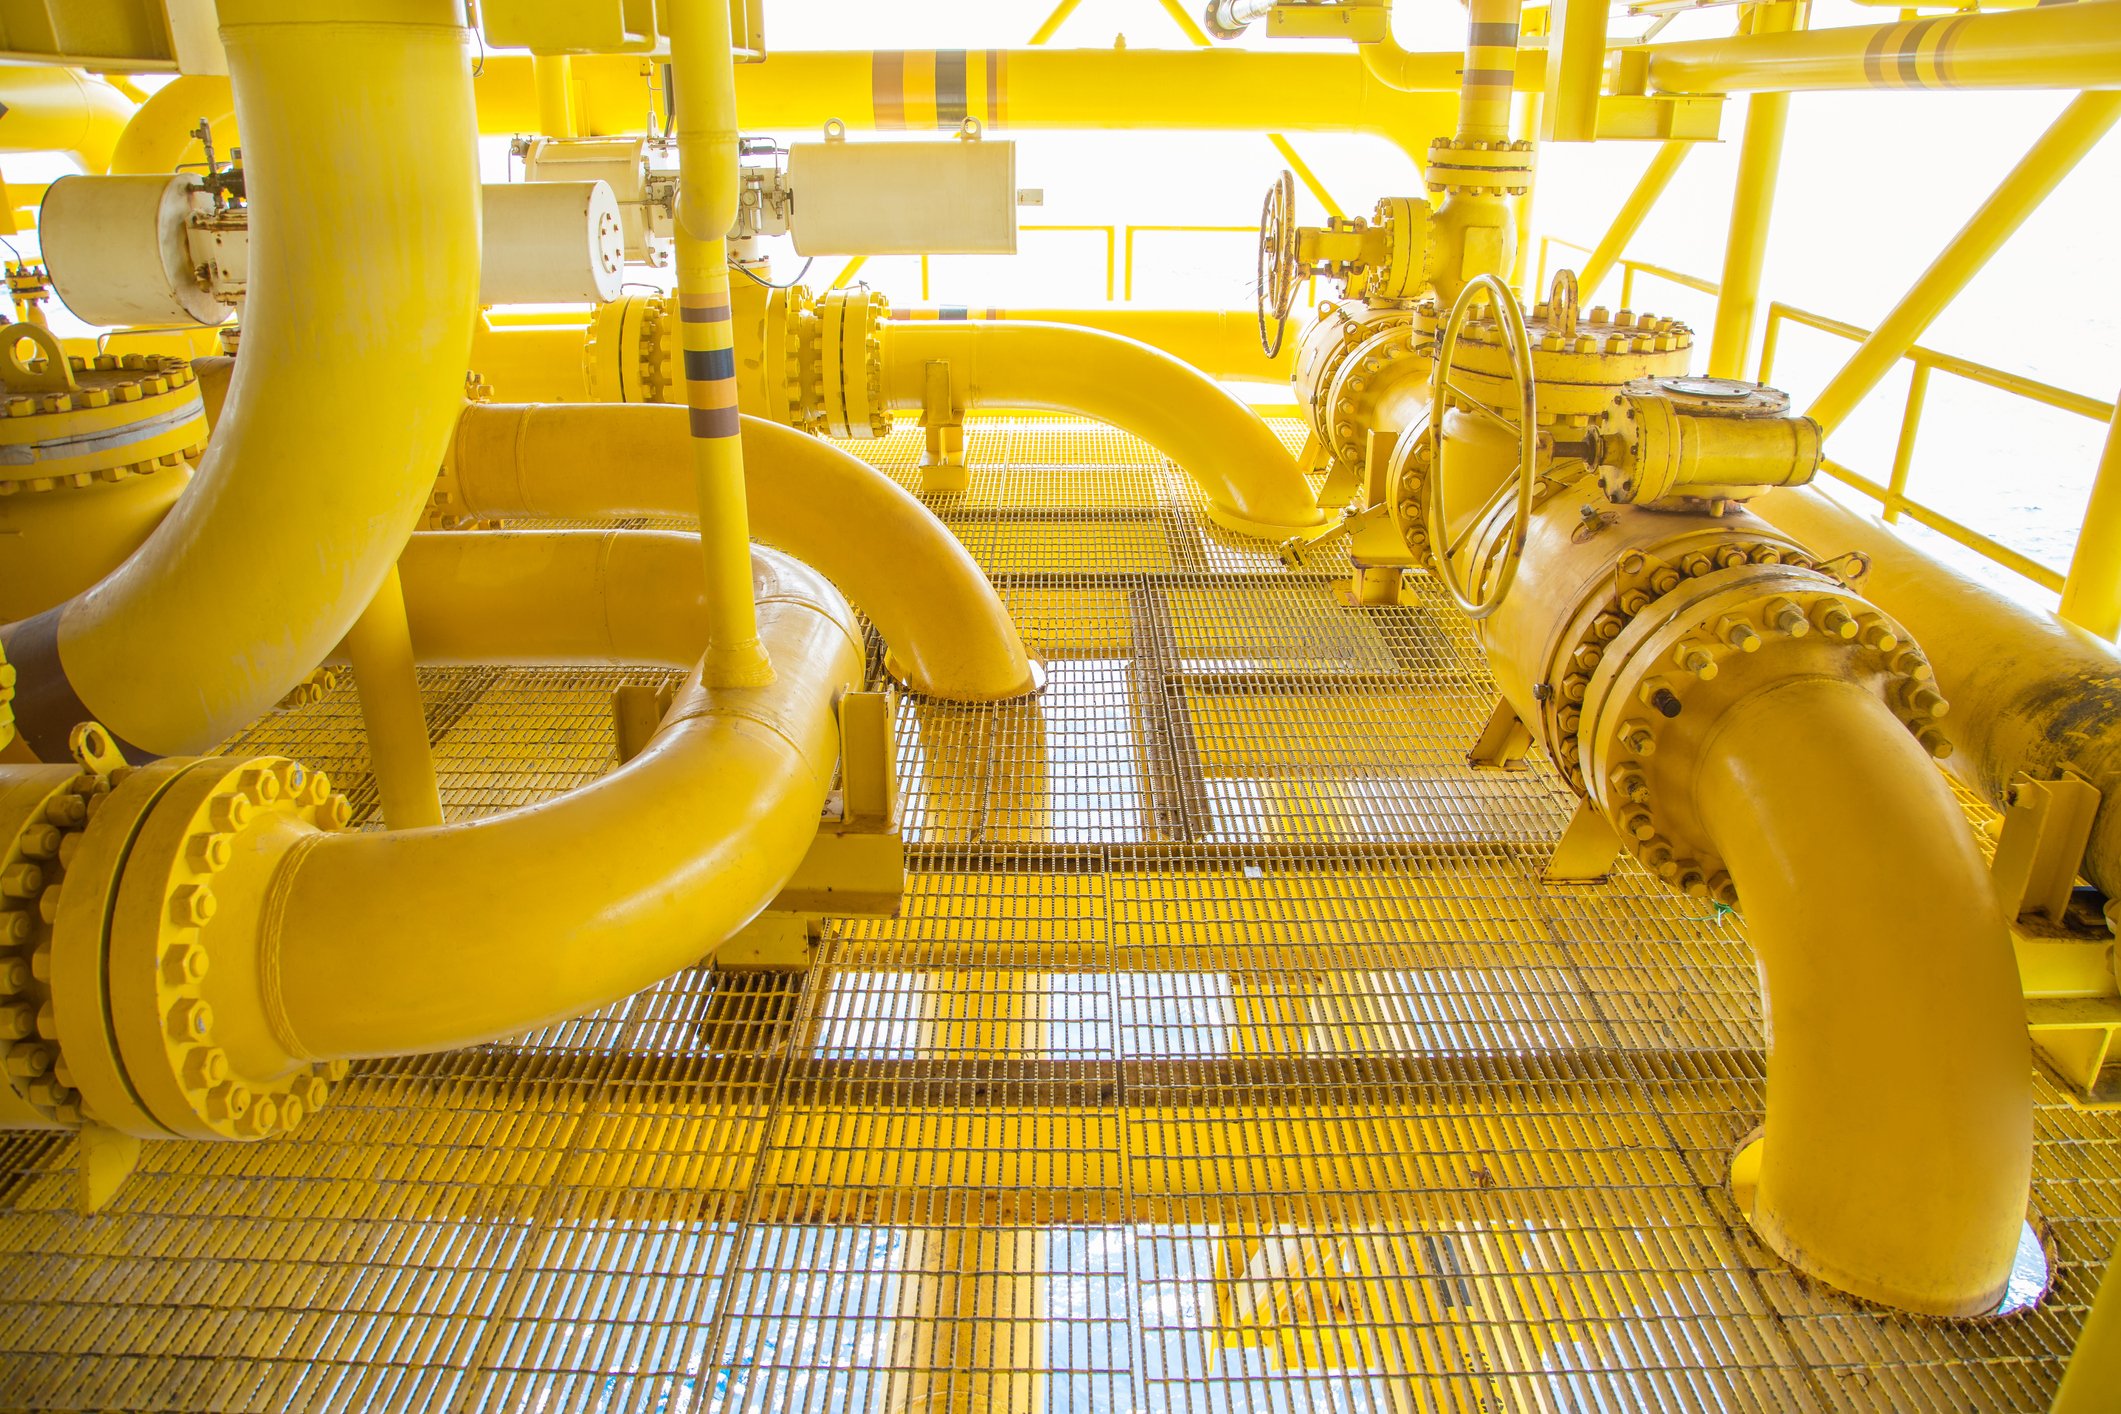
Flowserve helps move and manage liquids and gases for energy and chemical companies. It makes heavy-duty pumps, valves, and seals that keep large industrial plants running safely. These products help businesses produce electricity, clean water, and fuels for people worldwide.

What Flowserve Makes

  • Flowserve Pump Division: Custom and industrial pumps, mechanical seals, and systems used to move fluids; includes services like repairs and advanced equipment checkups.
  • Flow Control Division: Industrial valves and automation tools that manage the direction and flow of materials in complex pipelines.
  • Aftermarket Services: Support provided through a network of Quick Response Centers (QRCs) that handle urgent equipment fixes and maintenance.

New Moves and Growth

  • Launched the 3D Strategy to focus on diversifying markets, reducing carbon emissions, and using digital data tools.
  • Introduced RedRaven, an internet-connected platform that monitors industrial equipment to predict when it might break down.
  • Developed the Energy Advantage Program to help customers reduce their power use and carbon footprint through better engineering.
  • Terminated all business operations in Russia in March 2022 following the conflict in Ukraine.

A Global Service Footprint

The company operates a network of 152 Quick Response Centers across more than 48 countries to provide local repairs. This setup allows them to deliver specialized seal orders within 72 hours of a customer request.

Financial Performance

  • Revenue reached $1.2 billion in Q4 2025, up 3.5% from the previous year.
  • Operating income hit $184.8 million in Q4 2025, a 31.9% increase year-over-year.
  • Gross profit grew to $425.4 million in Q4 2025, up 10.9% from Q4 2024.
  • The company reported a net loss of $29 million in Q4 2025, down 137.4% from a profit of $77.5 million in Q4 2024.
  • Total order backlog stood at $2.9 billion as of December 31, 2025.

The Bottom Line

Flowserve has transitioned from a traditional equipment maker into a service-focused provider using digital monitoring and green energy solutions. Its ability to support the global energy transition while maintaining a multi-billion dollar order backlog defines its current path.

AI Generated • Apr 21, 2026

Industry

Machinery

Employees

16,000

CEO

Robert Scott Rowe, MBA

Headquarters

Irving, TX 75039, US

FLS Financials

Key Financial Metrics (TTM)

Gross Margin

35.53%

Operating Margin

12.64%

Net Income Margin

7.61%

Return on Equity

15.93%

Return on Capital

15.54%

Return on Assets

6.17%

Earnings Yield

4.00%

Dividend Yield

1.27%

Payout Ratio

30.72%

Stock Overview

Market Cap

$8.63BMarket cap calculated using publicly traded shares outstanding only. Does not include unlisted, private, or dual-class non-traded shares. Implied market cap may vary.

Shares Outstanding

127.81M

Volume

85.63K

Avg. Volume

2.36M

Financials (TTM)

Gross Profit

$1.65B

Operating Income

$588.13M

EBITDA

$709.71M

Operating Cash Flow

$512.74M

Capital Expenditure

-$76.09M

Free Cash Flow

$436.65M

Cash & ST Invst.

$792.35M

Total Debt

$1.89B

Flowserve Performance Analysis

Flowserve annual revenue and year-over-year revenue growth by fiscal year
Fiscal yearPeriod endRevenueYoY growth
20222022-12-31USD 3,615,120,0002.1%
20232023-12-31USD 4,320,577,00019.5%
20242024-12-31USD 4,557,806,0005.5%
20252025-12-31USD 4,729,260,0003.8%
Flowserve sequential (quarter-over-quarter) revenue growth by fiscal quarter
Fiscal quarterPeriod endQoQ growth
Q22025-06-303.8%
Q32025-09-30-1.1%
Q42025-12-314.1%
Q12026-03-31-12.6%
Flowserve annual diluted earnings per share and year-over-year EPS growth by fiscal year
Fiscal yearPeriod endDiluted EPSYoY growth
20222022-12-31USD 1.4449.3%
20232023-12-31USD 1.42-1.5%
20242024-12-31USD 2.1450.9%
20252025-12-31USD 2.6423.7%
Flowserve sequential (quarter-over-quarter) diluted earnings per share growth by fiscal quarter
Fiscal quarterPeriod endQoQ growth
Q22025-06-3010.7%
Q32025-09-30169.4%
Q42025-12-31-113.8%
Q12026-03-31378.3%

Revenue Growth Rate

Annual and quarterly growth comparison

Earnings Per Share Growth Rate

Annual and quarterly EPS growth comparison

Quarterly Performance

Name
Q1 2026YOY CHG

Revenue

$1.07B

-6.7%

Gross Profit

$396.34M

+4.5%

Gross Margin

37.10%

N/A

Market Cap

$8.63BMarket cap calculated using publicly traded shares outstanding only. Does not include unlisted, private, or dual-class non-traded shares. Implied market cap may vary.

N/A

Market Cap/Employee

$539.35K

N/A

Employees

16,000

N/A

Net Income

$81.68M

+10.5%

EBITDA

$151.97M

+8.0%

Quarterly Fundamentals

Name
Q1 2026YOY CHG

Total Cash

$792.35M

+46.5%

Total Debt

$1.89B

+12.5%

Accounts Receivable

$1.32B

-2.9%

Inventory

$809.58M

-3.8%

Long Term Debt

$1.80B

+12.5%

Short Term Debt

$88.44M

+13.5%

Return on Assets

6.17%

N/A

Return on Invested Capital

13.50%

N/A

Free Cash Flow

-$59.98M

+2.7%

Operating Cash Flow

-$43.08M

+13.7%

Other Investments to Explore

People Also Watch

Symbol / CompanyPricePrice Chg
AOSA. O. Smith Corporation
$59.35+1.00%
GTLSChart Industries, Inc.
$209.90-0.00%
POOLPool Corporation
$196.19-0.09%
DCIDonaldson Company, Inc.
$90.96+0.86%

Trending Stocks

Symbol / CompanyPricePrice Chg
TAT&T
$23.04+0.04%
ONDSOndas
$8.00+0.04%
SMCISuper Micro Computer
$30.56+0.20%
AALAmerican Airlines Group
$14.79-0.03%

Questions About FLS

What is the current price of Flowserve?

Flowserve is trading at $68.61 per share.

What is the 52-week range for Flowserve?

Over the past 52 weeks, Flowserve has traded between $48.71 and $92.41.

How much debt does Flowserve have?

As of the most recent reporting period, Flowserve reported total debt of $1.89B.

How much cash does Flowserve have on hand?

Flowserve reported $792.35M in cash and cash equivalents in its most recent financial results.

What is Flowserve’s dividend yield?

Flowserve currently has a dividend yield of 1.27%.

Premium Investing Services

Invest better with The Motley Fool. Get stock recommendations, portfolio guidance, and more from The Motley Fool's premium services.