The CAGR formula is:
((((ending value/beginning value) raised to the power of 1/n)-1)x100).
Here is the formula, broken down into four steps:
- Divide the beginning value into the ending value. For our example, this would be $150 divided by $50, which equals 3.
- Divide 1 by the number of years. The answer here for our example is 0.2.
- Next, you'll use the number from the previous step, 0.2, as an exponent, applied to the number from the first step. In other words, you raise the value calculated in the first step to the power calculated in the second step. A calculator or spreadsheet can do this for you. The rounded answer with our numbers is 1.246.
- Subtract 1 from 1.246 to get to 0.246. Convert that decimal into a percentage by multiplying by 100. That equates to a CAGR of 24.6%.
You can test the calculated CAGR by applying the unrounded percentage to the starting value five times.
- Year 1: $50 grows to $62.29.
- Year 2: $62.29 grows to $77.59.
- Year 3: $77.59 grows to $96.66.
- Year 4: $96.66 grows to $120.41.
- Year 5: $120.41 grows to $150.
What you can and can't do with CAGR
CAGR is useful for comparing asset behavior. You can use it to evaluate a stock against its peer group or a benchmark index. Or, you can rely on CAGR metrics to track and measure your entire portfolio relative to the market as a whole.
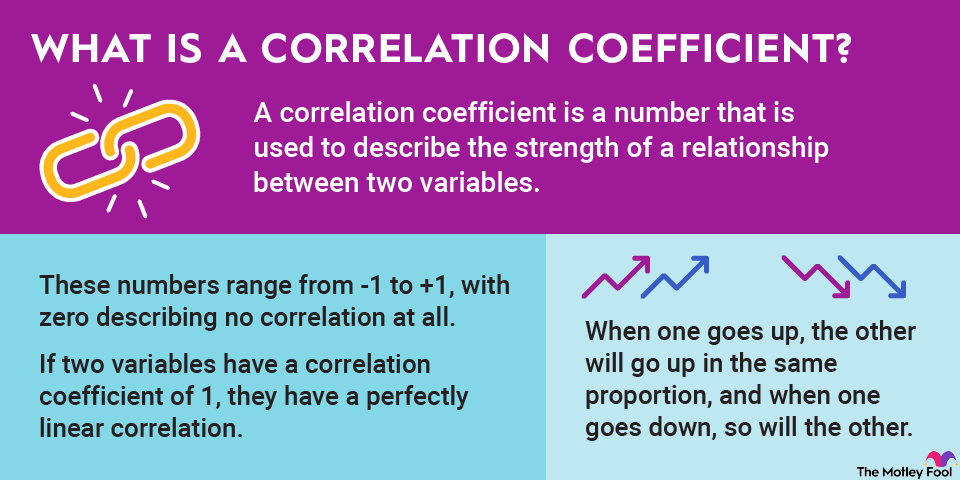
You can also use CAGR to compare assets that are less correlated, such as stocks and gold. A longer time frame is necessary for that comparison, to ensure you're covering positive and negative cycles for both asset types.
You cannot use CAGR if you are contributing to or withdrawing from a position, however. The formula assumes a single initial investment. If you make contributions during the measurement period, the calculated CAGR would overstate actual growth. Likewise, distributions would understate actual growth.
Also note that CAGR only quantifies growth; it does not measure risk or volatility. In our example above, the stock produced a CAGR of 24.6% by going from $50 to $150 in five years. That value change could happen with slow-and-steady growth or with radical fluctuations. The CAGR measurement alone sheds no light on the path between the starting and ending values.
