To net working capital, you then add property, plants, and equipment, goodwill, and other operating assets to get invested capital.
For example, if a company had $2 billion in current assets; $1 billion in non-interest-bearing current liabilities; $2.5 billion in property, plants, and equipment; $500 million in goodwill; and $1 billion in other operating assets, it would have invested capital of $5 billion.
You may reduce invested capital by excess cash, which is any cash not needed for day-to-day operations. There are no hard and fast rules, however, for determining how much cash is necessary and how much is excess.
Putting it all together
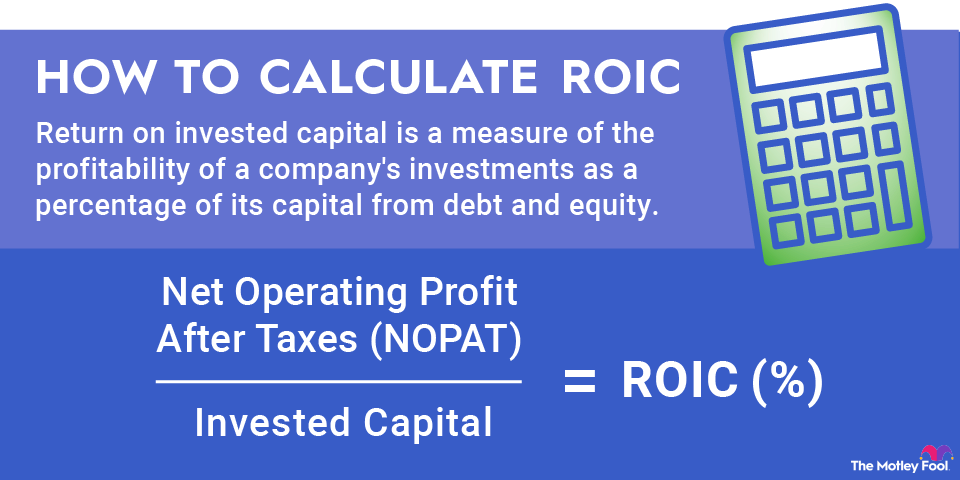
Once you have NOPAT and invested capital figured out, it's a simple division problem.
From the example given above, ROIC = $750 million / $5 billion = 15%.
Drawbacks of ROIC
There are a few drawbacks of using ROIC.
Many companies operate multiple segments. Some may be extremely capital-intensive; others may not. They may operate in entirely different industries from one another. Since ROIC takes into account the entire company's operations, it can be difficult to know whether the bulk of value is generated by a single segment or if the entire company is producing strong investment returns.
The metric also is less applicable to some industries than others. Trying to use ROIC to evaluate financial companies is going to create a mess because banks and insurance companies use capital in their products.
Some factors might generate misleading ROIC numbers. For example, a company with a lot of goodwill on its balance sheet will generate a lower ROIC as a result of the bigger denominator. If a company writes down goodwill, you'll need to make adjustments to perform a useful historical analysis of its ROIC.
Lots of capital leases compared to competitors also may skew the results of ROIC analysis unless you make adjustments to account for leases. Excess cash on hand will deflate ROIC unless adjusted. Since cash isn't really invested capital, any excess cash on hand should be removed from net working capital.
Additionally, a non-recurring event generating a big gain or loss could affect profits and shouldn't be used for evaluating normal operations of the business. Be sure to account for differences in balance sheets and anomalies in the income statements when comparing ROIC across companies.
Real-world example of ROIC
Let's take a look at Walmart's (WMT +0.87%) return on invested capital from fiscal 2022.
First, we need to calculate Walmart's NOPAT. To do that, we can take its operating income of $25.942 billion and multiply by its effective tax rate of 25.44%. While the effective tax rate isn't necessarily the same as its marginal tax rate, it presents the best approximation of the figure available. As such, we get a NOPAT of $19.342 billion.
Next, determine Walmart's invested capital. Walmart had $244.86 billion in total assets on its balance sheet at the end of fiscal 2022. That includes capital and finance lease rights-of-use, but those are arguably necessary for its operations. It had $82.172 billion in accounts payable, accrued liabilities, and accrued taxes, leaving it with $162.688 billion in invested capital. Its cash holdings of $14.76 billion seem reasonable enough, so no adjustments are needed.
Doing the same calculation for invested capital at the beginning of the year results in a total of $165.147 billion. So, the average invested capital over the year was about $163.918 billion.
Therefore, Walmart's ROIC in 2022 = $19.432 / $163.918 = 11.8%.
Related investing topics


