Did you ever scratch your head at the term "volume" while researching the stock market? Don't worry -- you're in good company. Today, I'll demystify this often-used but frequently misunderstood term.

What is volume in stocks?
What is volume in stocks?
In the wide world of stocks, "volume" represents the number of shares traded during a defined period, typically a day. You'll often see the full term spelled out, too. When you're looking at the stock market, "volume" is the same thing as "trading volume."
Think of it like tracking the number of cups of coffee sold at your favorite cafe in a day. So, if you come across a headline stating that "Hypothetical Healthcare, Inc. saw a trading volume of 5 million," it simply means that 5 million shares of that made-up stock were traded that day. As they say, it's not rocket surgery!
Decoding market sentiment
Decoding market sentiment
"Now, why would I care about volume?" you might wonder. "Isn't investing all about the stock price?" While price is indeed important, volume is like the trusty sidekick who often gets overlooked. This metric can tell you things that aren't obvious from the stock's price moves alone.
Think of volume as a thermometer, gauging the temperature of investor interest in a particular stock. High trading volume indicates significant investor interest and liquidity, meaning you can buy or sell shares with minimal price impact. Low volume, on the other hand, might suggest investor apathy.
The long-term average is particularly useful. A stock with consistently low volume over time could be a deserted island in the ocean of the stock market, and it might be difficult to find buyers or sellers when you need them. Even a modest trade might be enough to move the pricing needle in this case.
Harnessing the power of trading volume
Harnessing the power of trading volume
Armed with the understanding of stock volume, what's next on your agenda?
Volume can be a handy tool when charting your course in the stock market. High volume, particularly when accompanied by a significant price change, may signal a market consensus about a stock. However, it's crucial to remember that volume is just one of many tools you should use to evaluate investment opportunities. Using volume without considering other factors would be like navigating without a compass: You might get lucky, but you're probably better off with a more comprehensive approach.
There is one more wrinkle to the trading volume story. You might want to look at "dollar volume" or "dollar-based trading volume" from time to time. In this case, you're not just looking at the number of shares trading hands but also accounting for the average share price. This helps you compare the market's trading interest in different stocks.
Here's how. Imagine two stocks: Allegory Appliances, priced at $10 per share, and Bogus Bioengineering, at $200 per share. If both have the same trading volume of 1,000 shares one fine Tuesday, a simple volume comparison would point to equal market activity.
However, the total value traded tells a different story. Allegory has a total dollar volume of $10,000 ($10 per share * 1,000 shares), while Bogus has a dollar volume of $200,000 ($200 per share * 1,000 shares). Hence, despite equal share volumes, Bogus Bioengineering actually shows significantly more market activity in comparison to Allegory Appliances when analyzed by their daily dollar volumes.
Volume in the real world
Volume in the real world
Remember when semiconductor designer Nvidia's (NVDA 2.62%) stock price skyrocketed in 2021? Let's revisit that wild ride.
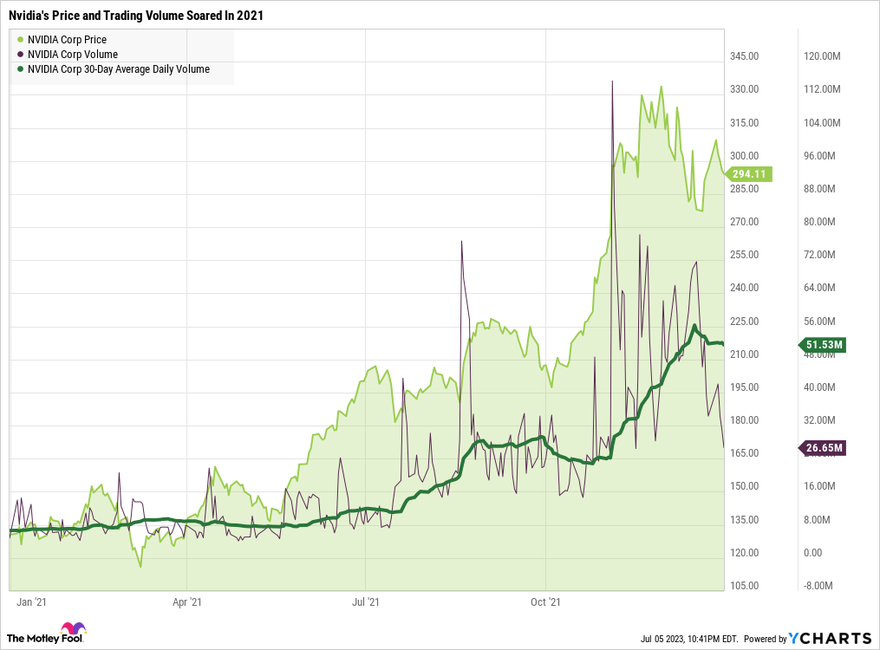
2021 was a special year for Nvidia. The stock soared on Metaverse developments, the expanding market for electric vehicles with self-driving features, a brief rekindling of the crypto-mining trend, and more. Nvidia's share price rose 125% that year.
Not only did the stock price soar, but the trading volume also spiked dramatically, reflecting intense investor interest. Nvidia became the talk of Wall Street, and the high volume underscored this narrative. The average daily trading volume rose by 677% in 2021. If you want to look at dollar volumes, Nvidia started the year with a daily trading volume of $866 million. Twelve months later, Nvidia popped the next year's champagne with a 30-day average dollar volume of $15.1 billion. In other words, Nvidia's dollar volume multiplied by 16 in a single year.
By the end of that run, Nvidia had been promoted from a promising tech stock to one of the largest names on the stock market, with trading volumes to match its newfound headline-making talents.
Related investing topics
Why volume is useful for investors
Why volume is useful for investors
In conclusion, understanding volume can give you a more nuanced view of the market dynamics. So next time you dive into the ocean of investing, remember to check the volume-based temperature, not just the pricing tides. After all, even seasoned sailors keep an eye on the weather report.