Ford Motor Company (F 0.72%) is up 19% year-to-date at $9.10, but the gain looks a little less sweet compared to the $10.50 achieved early in Q3. Things get even worse on the five and 10-year charts, which show the stock breaching $17 as recently as August 2014. The company has lost 47% of its market value in half a decade, and the latest slide was merely the latest in a series of setbacks for the car stock.
Ford's revenue has generally followed a slow, positive growth trend since the end of 2009 when the immediate impacts of the Great Recession began to fade. The company made a strategic decision last year to phase out sedan sales, focusing capital investments in trucks and SUVs. Since then, management accelerated this transition, and doubled-down on core markets that are producing the biggest wins, and turning away from markets like China. Analysts and investors have generally agreed on the short-term efficacy of this move, but it could have negative long-term ramifications if consumer tastes are impacted by changing factors, such as rising fuel prices.

Image Source: Ford
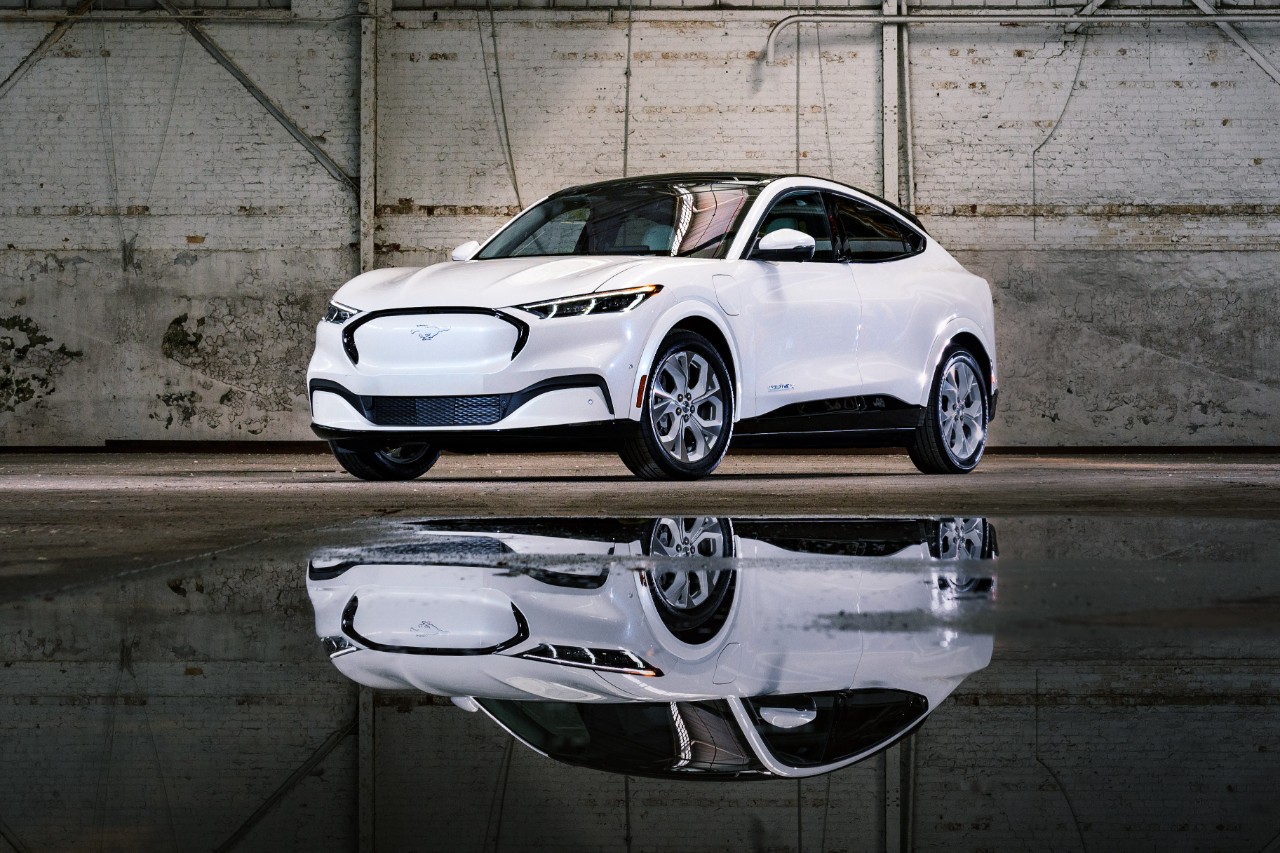
Ford's bullish observers ignore its slowing growth and falling margin, instead looking optimistically at its more focused product offering and business units like Ford Credit which produce excellent cash flow. The company has entered the electric vehicle market with a new car under the Mustang umbrella, showing intent to become meaningful competitors in a growth segment.
Ford looks cheap at first glance
Ford's 6.59% dividend yield is two to four percentage points higher than most major peers, with the exception of Daimler AG, the American depositary receipt of which pays a 6.61% yield. The established major auto manufacturers trade in a forward price-to-earnings range between GM's 5.88 and Toyota's (TM 1.58%) 11.9, and Ford falls near the low end of this spectrum at 6.33. Ford also appears to trade at a discount based on free cash flow, with 4.3 price-to-FCF that is less than half the industry average.
A deeper dive reveals some complicating factors
This apparent discount can be attributed primarily to two major factors. First, Ford's capital structure has much higher leverage than its peers. The company's debt-to-equity ratio is 4.36, nearly double the next highest, GM's 2.34. For comparison, Honda's (HMC 0.73%) debt-to-equity is only 0.92. A much higher proportion of Ford's operating profits are flowing to debt holders rather than equity holders, compared to other automakers. Ford's EV/EBITDA ratio at 13.6 illustrates this because the peer group generally sits in the 5.2 to 8.8 range, which indicates that the stock is actually not priced at a discount when accounting for capital structure.
The second major driver of the apparent valuation discount is a more pessimistic growth outlook. Consensus estimates call for flat to slightly lower revenue at Ford next year, with bottom-line contraction in the medium term. Both Honda and Toyota have modest positive outlooks and PEG ratios below 1.0, making Ford's P/E discount less meaningful. Furthermore, Ford's 1.5 dividend payout ratio and dwindling profits raise a real threat that dividends will be slashed moving forward. This threat takes most of the allure away from the high dividend for income investors and seriously jeopardizes the stock's intrinsic value based on the dividend discount model.
Investors are not expecting exceptional results from Ford, and the stock is not expensive by most valuation metrics, so there is room to the upside if the company delivers strong financial results next year. However, the stock does not actually trade at a meaningful discount to peers upon closer inspection. And, there is little to suggest that Ford is in a position to substantially outperform other automakers in the near term. There are other automotive stocks listed above that have reasonable valuations with strong outlooks, which fit many of the characteristics that bullish income or value investors would seek.


