How to Calculate Net Change in Cash From a Cash Flow Statement
How to Calculate Accrued Interest
How to Calculate Semi-Annual Bond Yield
How to Calculate a Monthly Return on Investment
How to Calculate the Number of Shares a Company Has
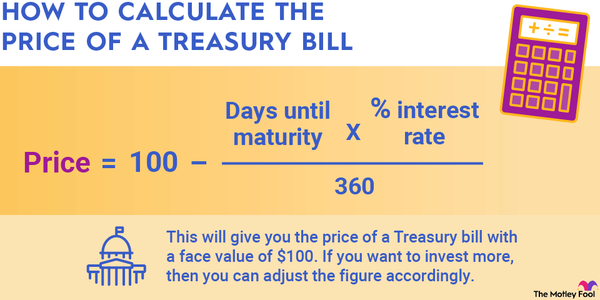
How to Calculate the Price of a Treasury Bill
Calculating the Percentage of an Over-Budgeted Amount
How to Calculate Annualized Volatility
How to Calculate Tax on W-9 Income
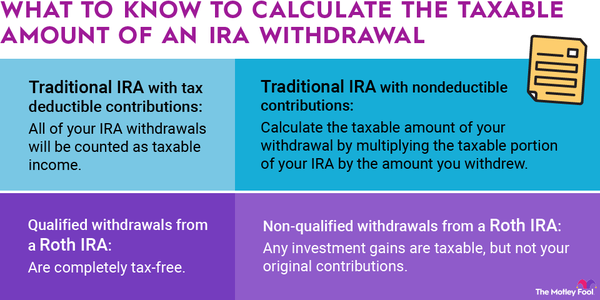
How to Calculate the Taxable Amount of an IRA Withdrawal
How to Calculate Revenue Growth for 3 Years
How to Calculate the Percentage of Annual Decline
How to Calculate the Present Value of Free Cash Flow
How to Calculate Average Shareholder Equity
How to Calculate Interest Rate Using Present and Future Value
How to Calculate the Net Worth on Financial Statements
How to Calculate Take-Home Pay as a Percentage of Gross Pay
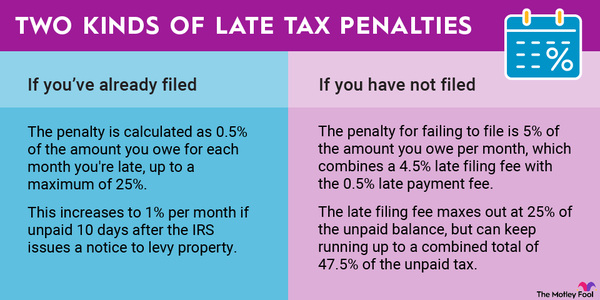
How to Calculate Interest Rate and Penalties on Late Taxes
How to Calculate the Annual Growth Rate for Real GDP
How to Calculate Taxes Using a Paycheck Stub
How to Calculate Interest Expenses on a Payable Bond
How to Calculate Annual Rate of Growth of Salary Increase
How to Calculate My Monthly Take-Home Salary
How to Calculate Unrealized Gain and Loss of Investment Assets
How to Calculate Total Expenses From Total Revenue and Owners' Equity
How to Calculate Weighted Average Price Per Share
How to Calculate the Interest Rate From an Income Statement
How to Calculate Income as a Percentage of Revenue
How to Calculate Cash Inflow Using Accounts Payable and Accounts Receivable
How to Calculate Direct Labor Rates in Accounting
How to Calculate Amortization and Depreciation on an Income Statement
How to Calculate Percentages of Total Revenue
How to Calculate Common Stock Outstanding From a Balance Sheet
How to Figure Out Beginning Stockholders' Equity
How to Calculate the Ratio of a Selling Price to an Asking Price
How to Calculate Total Monthly Net Income as a Percentage of Revenue
How to Calculate Provisional Income
How to Calculate Cost Basis in Dividend Reinvestment Plans
How to Calculate the Weights of Stocks
How to Calculate Interest on a Promissory Note
How to Calculate the Value of Stock Warrants
How to Calculate Foreign Exchange Gains or Losses
How to Calculate the Issue Price Per Share of Stock
How to Calculate Dividend Distribution of Preferred Stocks
How to Calculate the Historical Variance of Stock Returns
How to Calculate Pre-Tax Profit With Net Income and Tax Rate
How to Calculate Total Assets, Liabilities, and Stockholders' Equity
How to Calculate Par Value in Financial Accounting
How to Calculate a Marginal Revenue Derivative
How to Calculate Closing Costs When Paying Cash for a Home
How to Calculate Dividends Per Share From an Income Statement
How to Calculate Projected Annual Sales Growth
How to Calculate Additional Paid-In Capital in Accounting
How to Calculate an Average Percentage Difference Between Two Dollar Amounts
How to Calculate Total Revenue Growth in Accounting
How to Calculate Year-to-Date Earnings
How to Calculate Deadweight Loss to Taxation
How to Calculate the Turnover Ratio for Mutual Fund Investment Assets
How to Calculate Deferred Rent Expense
How to Calculate a Default Risk Premium
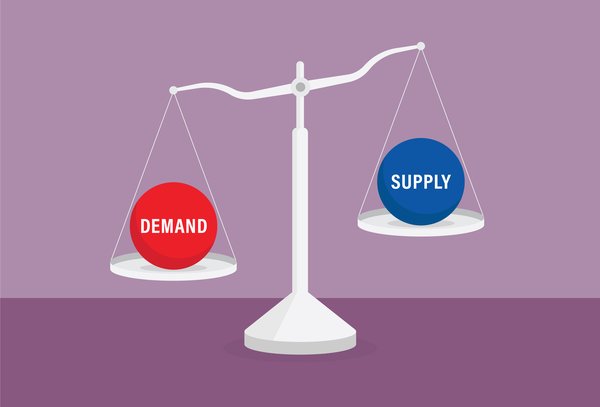
How to Calculate Market Price Using Supply and Demand
How to Calculate Cumulative Dividends Per Share
How to Calculate What My Penalty Will Be If I Cash Out My Retirement Account
How to Calculate the Marginal Tax Rate in Economics
How to Calculate a Company's Weighted Average Number of Outstanding Shares
How to Calculate Real Interest on After-Tax Income
How to Calculate the Average Revenue Per Unit
How to Calculate the Market Value of a Firm's Equity
How to Calculate Stockholders' Equity for a Balance Sheet
How to Calculate Your Tangible Net Worth With Subordinated Debt
How to Calculate Operating Income Return on Investment
How to Calculate Preferred Stock Outstanding
How to Calculate Taxable Income for Georgia State Income Tax
How to Calculate the Cost of Debt Pre-Tax
How to Calculate Yield for a Callable Bond
How to Calculate Interest Receivable and Interest Revenue for Notes Receivable
How to Calculate a Missing Account on an Income Statement
How to Calculate the Number of Shares of Common Stock Outstanding
Understanding Missouri's Capital Gains Tax
How to Calculate Capital Loss Carryover
How to Calculate Proceeds From Sales of Bonds
How to Calculate Dollar-Weighted Investment Returns
How to Calculate Selling and Administrative Expenses in Managerial Accounting
How to Calculate Change in Assets
How to Calculate Gain or Loss on a Bond Redemption
How to Calculate the Break-Even Interest Rate on Bonds
How to Calculate Capital Lease Interest Rates
How to Calculate Stock Price After Dividend
Calculating A Company's Net Income And Why It Matters
How to Calculate Cost Basis for Inherited Real Estate
How to Calculate Minority Interest Share in a Subsidiary
How to Calculate Modified Duration
How to Calculate Unearned Revenue
How to Calculate Net Revenue Interest for Oil & Gas
How to Calculate the Deduction for an S-Corp Home Office
How to Calculate Return on Assets for an Unlevered Company
How to Calculate Net Assets in a Statement of Activities and Changes in Net Assets
How to Calculate Impairment of Fixed Assets
How to Calculate Liquidity Premium and Real Risk
How to Calculate Percentage of Authorized Common Stock Issued
How to Calculate Average Treasury Stock Paid
How to Calculate Financial Variance When Budgeting for a Loss
How to Calculate Volatility With Spot and Strip Prices
How to Calculate a Bank's Liquidity Position
How to Calculate a Company's Total Margin Financial Ratio
How to Calculate Additions to Net Working Capital
How to Calculate Aggregate Adjustments
How to Calculate an Annual Return With Stock Prices
How to Calculate and Account for Stock Issuances
How to Calculate Capital Expenditure Depreciation Expense
How to Calculate Compounding on a Lump Sum at a Given Interest Rate
How to Calculate Disbursements of Cash
How to Calculate Discretionary Cash Flow
How to Calculate Ending Stockholders' Equity
How to Calculate Fair Value Adjustments to Stockholders' Equity With Available-for-Sale Securities
How to Calculate Hedge Fund Returns
How to Calculate Interest Rate From Account Balance and Interest Paid
How to Calculate IRA Early Distribution Penalty
How to Calculate IRR With Initial Outlay and Single Cash Flow
How to Calculate Maturity Risk Premiums
How to Calculate My Schedule K-1 Taxable Income for Another State
How to Calculate Net Asset Value for a Hedge Fund
How to Calculate Price-Weighted Average for Stocks
How to Calculate Rate of Return on Common Stock Equity
How to Calculate the Effective Interest Rate Including Discount Points
How to Calculate the Implied Value Per Share of Common Equity
How to Calculate the Interest Rates on Perpetuity
How to Calculate the Maturity Value of Notes


