Accessibility Menu
General Motors logo

General Motors(NYSE) GM

Market Cap$74.03BMarket cap calculated using publicly traded shares outstanding only. Does not include unlisted, private, or dual-class non-traded shares. Implied market cap may vary.
Since IPO (2010)+232%
5 Year+73%
1 Year+51%
1 Month+11%
$83.84
-0.63%
-0.53Today
General Motors last closing stock price
MetricPriceDate
Last closeUSD 84.372026-08-17
General Motors stock price return by period
PeriodPrice returnPrice at period startPeriod start date
1 week-4.08%USD 87.962026-08-10
1 month+10.91%USD 76.072026-07-17
3 month+16.42%USD 72.472026-05-19
Year to date+4.22%USD 80.952025-12-31
1 year+51.2%USD 55.802025-08-15
3 year+162.69%USD 32.122023-08-18
5 year+72.78%USD 48.832021-08-18
Since inception+232.42%USD 25.382010-11-18

General Motors Financials at a Glance

Market Cap

$74.03BMarket cap calculated using publicly traded shares outstanding only. Does not include unlisted, private, or dual-class non-traded shares. Implied market cap may vary.

Revenue (TTM)

$185.53B

Net Income (TTM)

$1.92B

EPS (TTM)

$1.98

P/E Ratio

42.56

Dividend

$0.66

Beta (Volatility)

1.18 (Average)

Price

$83.84

Volume

886,944.817

Open

$84.86

Previous Close

$84.37

Daily Range

$83.62 - $84.86

52-Week Range

$54.33 - $91.85

Estimated Earnings Date

Oct 20, 2026

GM: Motley Fool Moneyball Superscore

66

Our CEO Is Handing Members His Secret Weapon

It's called Motley Fool Moneyball, our new proprietary AI tool

We spent over half a million dollars in R&D to build a tool that makes stock research faster, sharper, and smarter. Our analysts use it every day, and now, you can too.

Get Access Now

About General Motors

General Motors Company makes cars, trucks, and SUVs for everyday use. It helps families and businesses travel and move goods safely. The company also provides financing and develops new electric technology.

Cars, Trucks, and Tech

  • North American Vehicles: Production of trucks, crossovers, and passenger cars for retail and fleet customers; generated $76.3 billion in revenue during the first half of 2026.
  • International Vehicles: Automotive operations in regions such as China, Brazil, and the Middle East; generated $6.6 billion in revenue in the six months ended June 30, 2026.
  • GM Financial: Lending, insurance, and vehicle protection services for customers and dealers; generated $8.5 billion in revenue during the six months ended June 30, 2026.
  • Autonomous Technology: Development of self-driving or autonomous vehicle (AV) technology through Cruise for future personal transportation and commercial use.

Strategic Moves and Milestones

  • Initiated a strategic realignment of electric vehicle (EV) capacity and manufacturing footprints during the year ended Dec. 31, 2025.
  • Renewed a $2.0 billion revolving credit facility in March 2026 for the exclusive use of the GM Financial segment.
  • Restructured the SAIC General Motors Corp., Ltd. joint venture in China during the six months ended June 30, 2026.
  • Increased the share repurchase program by $6.0 billion in Jan. 2026 and purchased $2.8 billion of common stock in the first half of the year.
  • Redeemed preferred shares from noncontrolling interest holders in the first half of 2025 as part of the Cruise segment restructuring.

Global Reach and Innovation

General Motors maintains a global manufacturing and distribution footprint through a mix of wholly owned operations and joint ventures across North America, South America, and the Asia Pacific. The company uses profitable internal combustion engine (ICE) trucks and SUVs to fund its multiyear transition into software-enabled services and electric vehicles.

Key Financial Metrics

  • Total net sales and revenue reached $91.7 billion in the six months ended June 30, 2026, up 0.6% year over year.
  • Net income attributable to stockholders was $3.1 billion for the six-month period ended June 30, 2026.
  • Automotive available liquidity totaled $33.6 billion at June 30, 2026, including $19.7 billion in cash and marketable debt securities.
  • Net automotive cash provided by operating activities was $5.6 billion in the first half of 2026.
  • Common stock dividends paid to shareholders totaled $0.3 billion during the six months ended June 30, 2026.

Moving Into the Future

General Motors is shifting from a traditional automaker to a provider of electric and autonomous transportation. The company uses cash flow from its internal combustion engine business to fund its long-term technology transformation.

AI Generated • Jul 22, 2026

Industry

Automobiles

Employees

155,000

CEO

Mary Teresa Barra, MBA

Website

www.gm.com

Headquarters

Detroit, MI 48265, US

GM Financials

Key Financial Metrics (TTM)

Gross Margin

5.74%

Operating Margin

0.98%

Net Income Margin

1.03%

Return on Equity

3.04%

Return on Capital

1.52%

Return on Assets

0.68%

Earnings Yield

2.35%

Dividend Yield

0.78%

Payout Ratio

60.92%

Stock Overview

Market Cap

$74.03BMarket cap calculated using publicly traded shares outstanding only. Does not include unlisted, private, or dual-class non-traded shares. Implied market cap may vary.

Shares Outstanding

877.45M

Volume

886.94K

Avg. Volume

7.61M

Financials (TTM)

Gross Profit

$10.64B

Operating Income

$1.81B

EBITDA

$13.21B

Operating Cash Flow

$23.20B

Capital Expenditure

-$6.70B

Free Cash Flow

$16.50B

Cash & ST Invst.

$24.72B

Total Debt

$127.70B

General Motors Performance Analysis

General Motors annual revenue and year-over-year revenue growth by fiscal year
Fiscal yearPeriod endRevenueYoY growth
20222022-12-31USD 156,735,000,00023.4%
20232023-12-31USD 171,842,000,0009.6%
20242024-12-31USD 187,442,000,0009.1%
20252025-12-31USD 185,019,000,000-1.3%
General Motors sequential (quarter-over-quarter) revenue growth by fiscal quarter
Fiscal quarterPeriod endQoQ growth
Q32025-09-303.1%
Q42025-12-31-6.8%
Q12026-03-31-3.7%
Q22026-06-3010.1%
General Motors annual diluted earnings per share and year-over-year EPS growth by fiscal year
Fiscal yearPeriod endDiluted EPSYoY growth
20222022-12-31USD 6.13-8.5%
20232023-12-31USD 7.3219.4%
20242024-12-31USD 6.37-13.0%
20252025-12-31USD 3.27-48.7%
General Motors sequential (quarter-over-quarter) diluted earnings per share growth by fiscal quarter
Fiscal quarterPeriod endQoQ growth
Q32025-09-30-29.3%
Q42025-12-31-366.7%
Q12026-03-31178.9%
Q22026-06-30-51.1%

Revenue Growth Rate

Annual and quarterly growth comparison

Earnings Per Share Growth Rate

Annual and quarterly EPS growth comparison

Quarterly Performance

Name
Q2 2026YOY CHG

Revenue

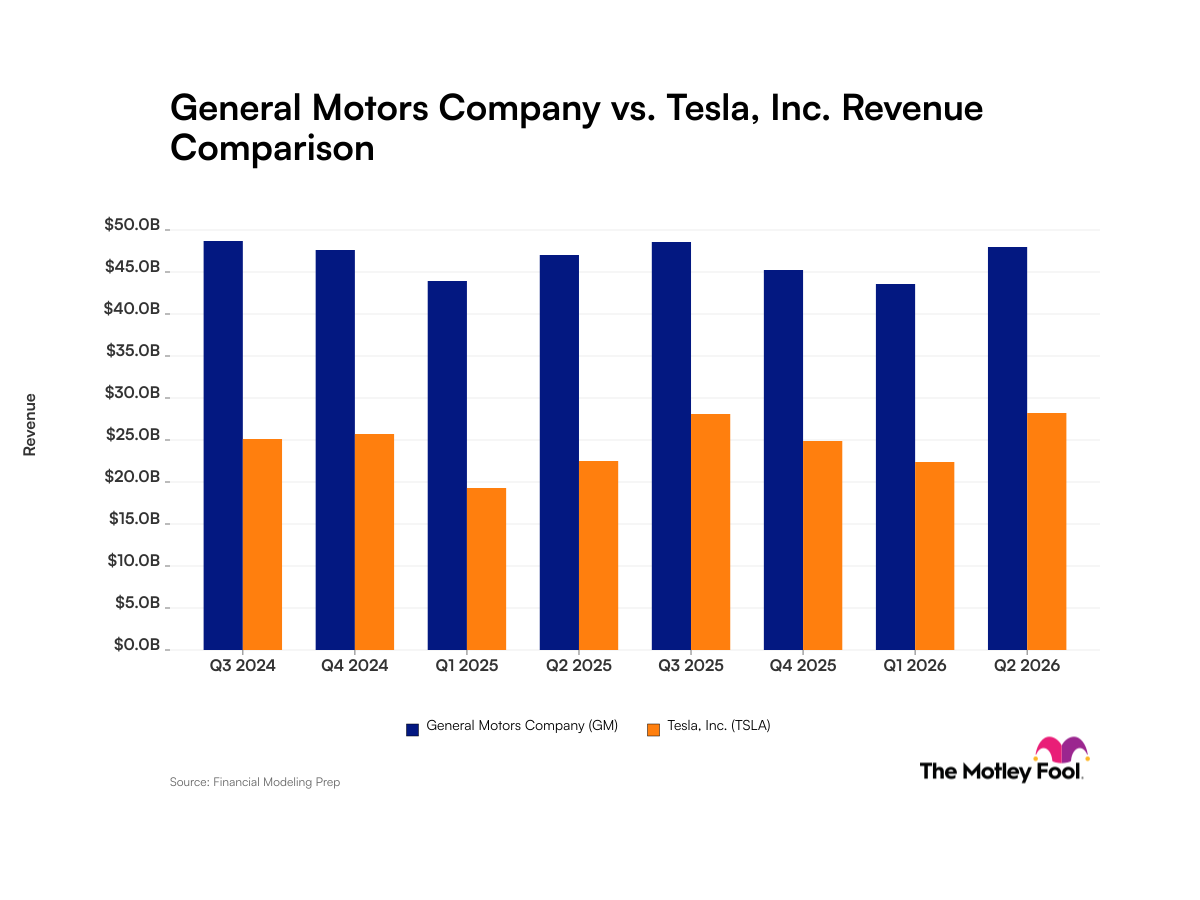
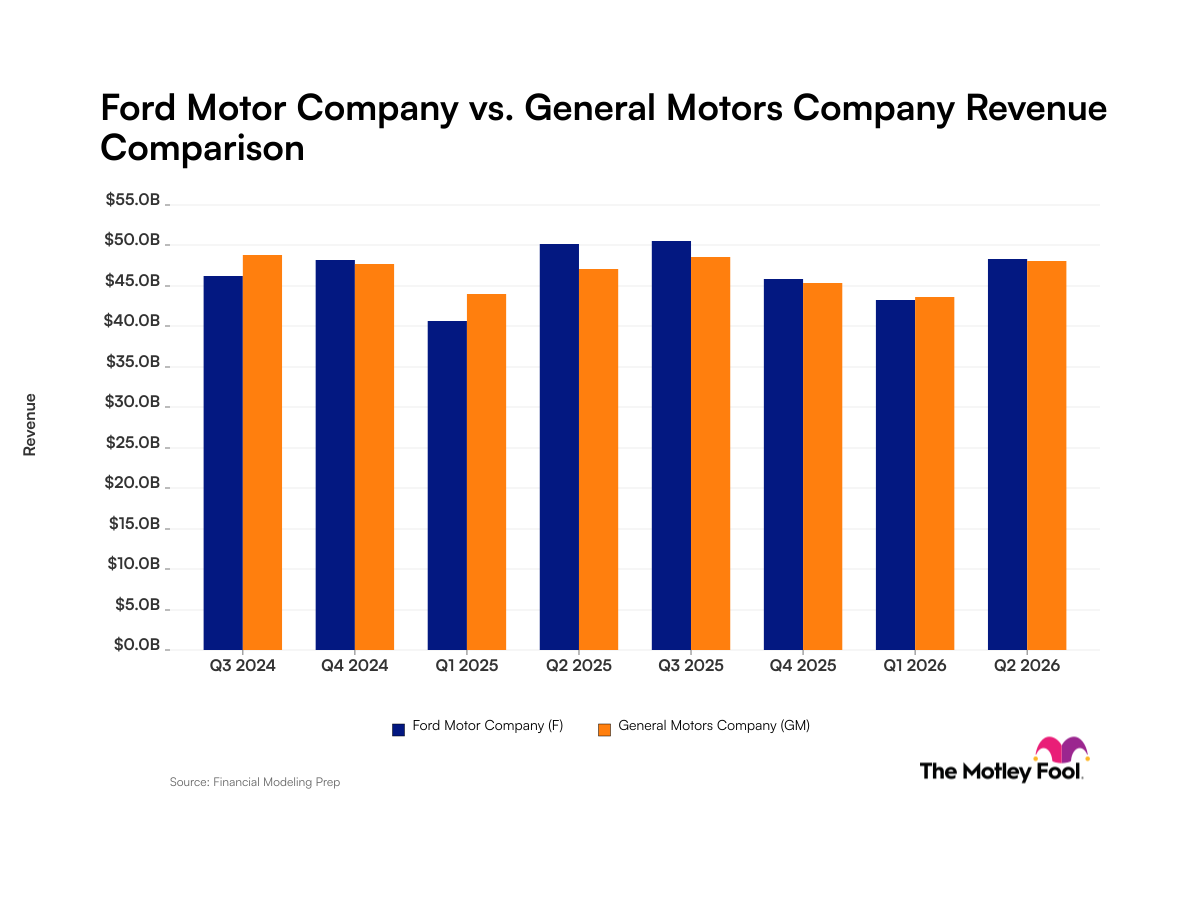
$48.03B

+1.9%

Gross Profit

$3.66B

-14.3%

Gross Margin

7.61%

N/A

Market Cap

$74.03BMarket cap calculated using publicly traded shares outstanding only. Does not include unlisted, private, or dual-class non-traded shares. Implied market cap may vary.

N/A

Market Cap/Employee

$474.56K

N/A

Employees

156,000

N/A

Net Income

$1.27B

-32.8%

EBITDA

$3.37B

-40.0%

Quarterly Fundamentals

Name
Q2 2026YOY CHG

Total Cash

$24.72B

-15.7%

Total Debt

$127.70B

-5.9%

Accounts Receivable

$16.77B

-72.6%

Inventory

$15.95B

+3.2%

Long Term Debt

$90.69B

-7.3%

Short Term Debt

$37.01B

-3.4%

Return on Assets

0.68%

N/A

Return on Invested Capital

0.98%

N/A

Free Cash Flow

$4.41B

+1025.5%

Operating Cash Flow

$6.35B

-8.0%

Other Investments to Explore

People Also Watch

Symbol / CompanyPricePrice Chg
HLTHilton Worldwide Holdings Inc.
$330.89+1.46%
RACEFerrari N.V.
$414.68-0.58%
ORLYO'Reilly Automotive, Inc.
$91.90+1.85%
RCLRoyal Caribbean Cruises Ltd.
$301.94+0.05%

Trending Stocks

Symbol / CompanyPricePrice Chg
NOKNokia
$10.38-0.04%
INTCIntel
$96.36-0.07%
SOXSDirexion Shares ETF Trust - Direxion Daily Semiconductor Bear 3x ETF
$44.64+0.16%
SOXLDirexion Shares ETF Trust - Direxion Daily Semiconductor Bull 3x ETF
$127.50-0.16%

Questions About GM

What is the current price of General Motors?

General Motors is trading at $83.74 per share.

What is the 52-week range for General Motors?

Over the past 52 weeks, General Motors has traded between $54.33 and $91.85.

How much debt does General Motors have?

As of the most recent reporting period, General Motors reported total debt of $127.70B.

How much cash does General Motors have on hand?

General Motors reported $23.13B in cash and cash equivalents in its most recent financial results.

What is General Motors’s dividend yield?

General Motors currently has a dividend yield of 0.78%.

Premium Investing Services

Invest better with The Motley Fool. Get stock recommendations, portfolio guidance, and more from The Motley Fool's premium services.