Valuation is the process of figuring out what something is worth. Spoiler alert: Stocks and other assets usually don't cost (the price) what they're truly worth (the value) -- they can be either overpriced or underpriced. Investors can achieve better long-term returns by consistently identifying investments that are mispriced and using this knowledge to their advantage.
Overview
What valuation is
A company that goes public sells shares to investors, with each representing a small percentage ownership stake in the business. Valuation seeks to determine what those businesses are worth now or what those businesses could be worth at some future date. The process is both a science and an art. It's a science because it's a fundamental analysis that uses numbers and formulas. But it's also an art because investors need to use estimates and make some assumptions as well, injecting a measure of uncertainty. The more uncertainty there is to the valuation process, the harder it is to confidently assign a higher value.
There are two major camps when it comes to valuation: intrinsic value and relative value. On one hand, the intrinsic valuation process attempts to predict all of the future cash flows for the life of the asset to determine the present value of the asset. This can be especially helpful when investing in something with a known return (such as a bond) or when buying a business outright. On the other hand, the relative valuation process is especially helpful for stocks since they frequently change hands and usually represent businesses with unknown lifespans. This relative valuation approach applies a premium to the fundamental numbers (20 times a company's profit, for example) based on what the market will support.
How it works
How valuation works
Investing great Warren Buffett prefers the intrinsic valuation method because he acquires businesses outright when the price is attractive. And he once gave a great example at a meeting for shareholders of his company Berkshire Hathaway (BRK.A 0.98%)(BRK.B 0.98%). In the 1970's, he bought See's Candies for $25 million. But it's earned around $2 billion cumulatively in his 50 years of owning it. From this, we see that Buffett clearly bought See's Candies for far below its intrinsic value -- he got far more out of it than what he put into it. And this ultimately means that he made a small fortune from this one investment.
Most investors aren't buying entire businesses, but many still use the principles of intrinsic value when investing in stocks. However, investors more commonly use relative valuation methods. For example, let's say that you can predict with a high degree of certainty that a shoe company will have earnings per share of $10 within the next five years. Shoe stocks commonly trade at 10 times earnings, if not more. Using a relative valuation method, investors could comfortably predict that this particular shoe stock will be worth $100 per share within the next five years. If that stock trades at, say, $25 per share today, you may have just stumbled upon an undervalued investment opportunity that could help you make your own small fortune.
Methods
Valuation methods
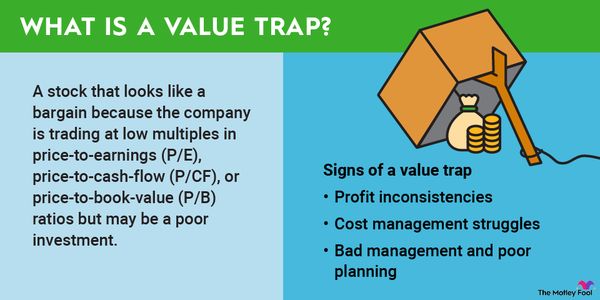
In the above example, investors would use the price-to-earnings (P/E) ratio to value my imaginary shoe business. But there are situations when things aren't so simple, and different valuation tools are helpful. For example, companies without earnings can't be valued with a P/E ratio because earnings are literally part of the equation. But this doesn't necessarily mean that those businesses are worthless, so they instead might be valued with a price-to-sales (P/S) ratio. Additionally, accounting practices can distort profits, which is why many investors like to value a company with the price-to-free cash flow ratio. In short, there are many popular valuation metrics, and each has merits.
However, investors should remember that many metrics share a key shortcoming. Renowned value investor Bill Miller puts it this way, "One hundred percent of the information you have about a company represents the past, and 100% of the value depends on the future." In other words, investors can't solely rely on the known numbers, but rather, they also need to have an opinion about what will happen with the business, the industry, and the economy.
This is why having an investment thesis is crucial when investing in a stock. A thesis will address things such as whether a market opportunity will get bigger or smaller, whether business growth will accelerate or decelerate, and whether profit margins will strengthen or deteriorate. By getting a handle on such things, investors can have an idea of the future financial state of the business. From there, they can use a valuation metric, or a combination of metrics, to determine the valuation of the company. This valuation assumption will help them decide whether it's mispriced in their favor today.
Related investing topics
Example
A valuation example
In early 2025, artificial intelligence (AI) is a big investing topic and Nvidia (NVDA 1.28%) is a top player in the space. Market analysts have predicted a large market opportunity in AI long before it dominated the headlines. For his part, Nvidia's founder and CEO, Jensen Huang, delivered the first AI supercomputer in 2016. At the time, Nvidia stock was trading at a P/S ratio of about 6.
Let's say that you were aware of the predictions for the AI space and were familiar with Nvidia's AI-focused products. Perhaps you didn't know exactly how high the company's revenue would soar, but you believed it would go up significantly over the coming decade. Well, even though a P/S ratio of 6 isn't exactly cheap, you still may have concluded that Nvidia stock was undervalued in 2016 because you had a high degree of certainty that it would be an AI leader, and revenue would consequently skyrocket. This is exactly what happened -- Nvidia stock is one of the greatest performers over the last decade, in large part because its revenue is almost 20 times larger today than it was in 2016 when the first AI supercomputer was delivered.